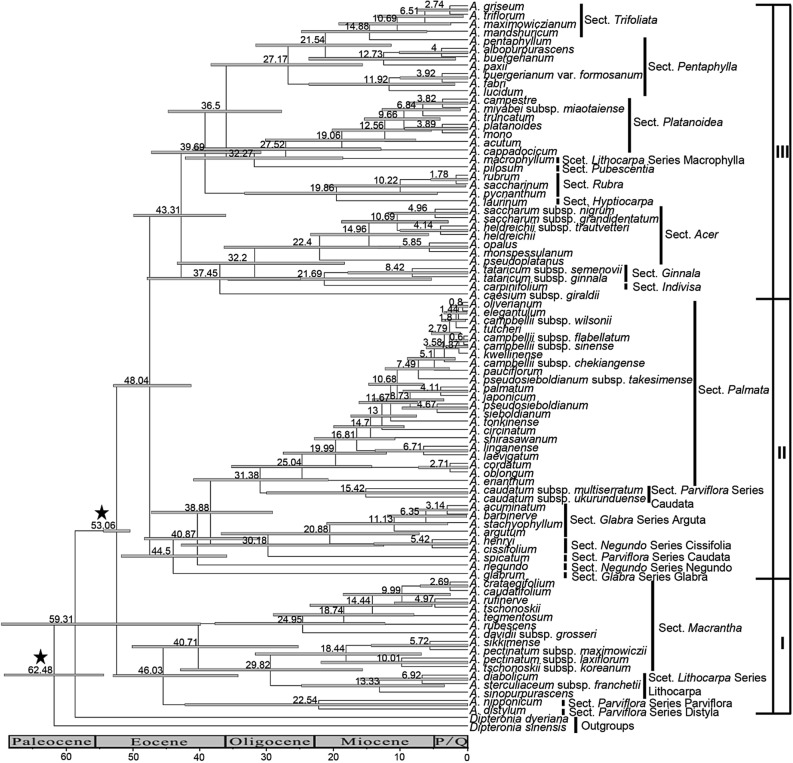
Figure 2.
Chronogram for Acer reconstructed based on the combined data matrix (nuclear ribosomal ITS, plastid psbA-trnH spacer, rpl16 intron, and trnL-trnF spacer). Stars indicate the calibration points inferred from fossil records. Numbers on nodes indicate time to the most recent common ancestor (MRCA). Each numbered node bar represents the minimum and maximum ranges of dates for MRCA summarized from both Low and High calibration. The diagram was generated by Microsoft PowerPoint 2019 (https://www.microsoft.com/zh-cn/microsoft-365/powerpoint).

