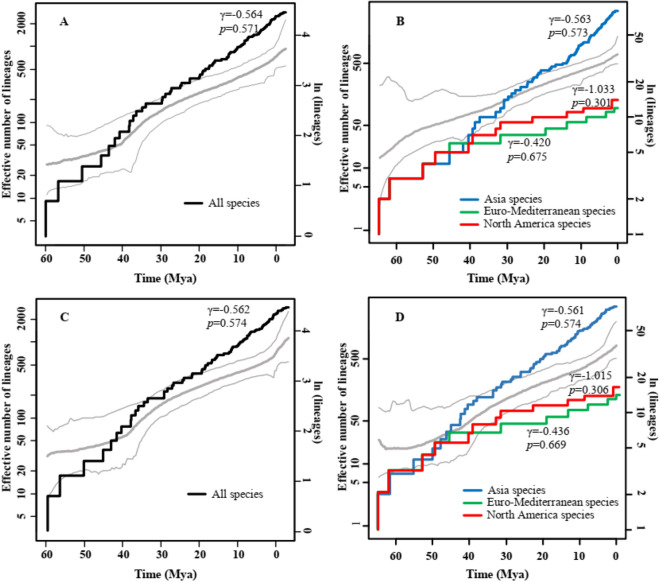
Figure 3.
Temporal analysis of diversification rates. The lineage-through-time (LTT) of Acer species and reversible jump Markov chain Monte Carlo (rjMCMC) simulation of Acer (gray curves: bold line indicates mode value, and thin lines indicate 95% confidence intervals; left y-axis). (A) All species (dark curve, left y-axis). (B) Species from different regions (color curve, left y-axis). (C) All species except 11 subspecies (including varieties) which derived from one species (different subspecies of the same species) (dark curve, left y-axis). (D) Species (except 11 subspecies) from different regions (color curve, left y-axis). The diagrams of (A–D) were generated by Microsoft PowerPoint 2019 (https://www.microsoft.com/zh-cn/microsoft-365/powerpoint).

