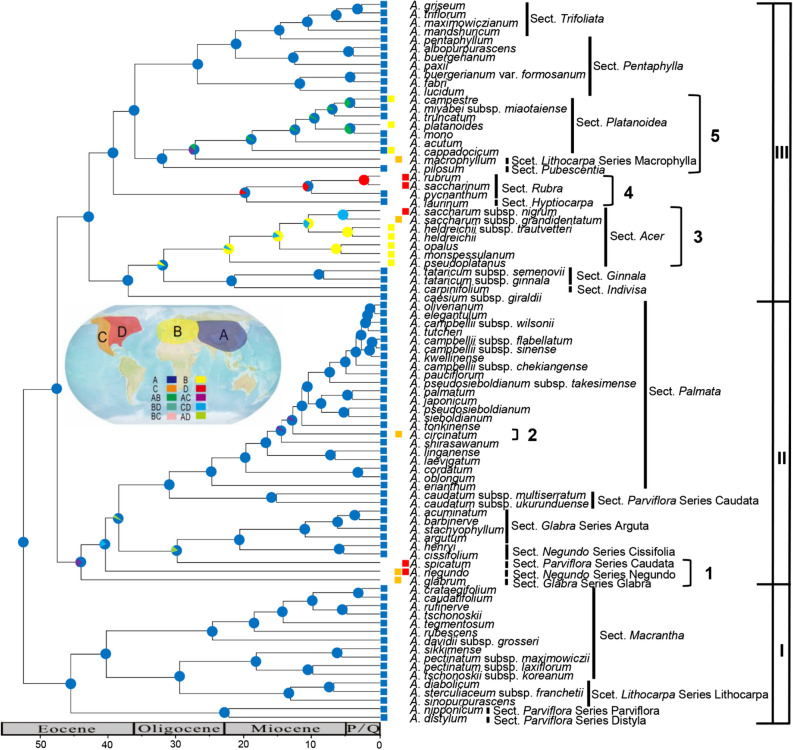
Figure 4.
Ancestral area reconstruction for the genus Acer based on the combined data matrix (nuclear ribosomal ITS, plastid psbA-trnH spacer, rpl16 intron, and trnL-trnF spacer). The one- and two-letter codes in the inset represent different geographic ranges. The map shows the geographical extents of the four areas ((A) Asia, (B) Euro-Mediterranean, (C) western North America, (D) eastern North America) considered in the analysis. The pie charts on the nodes show the most likely ancestral areas (correspond to the colors in the inset) as reconstructed by BioGeoBEARS. Current distributions are indicated before the species names. Branches 1–5 represent five migration events of Acer. The diagram was generated by Microsoft PowerPoint 2019 (https://www.microsoft.com/zh-cn/microsoft-365/powerpoint).

