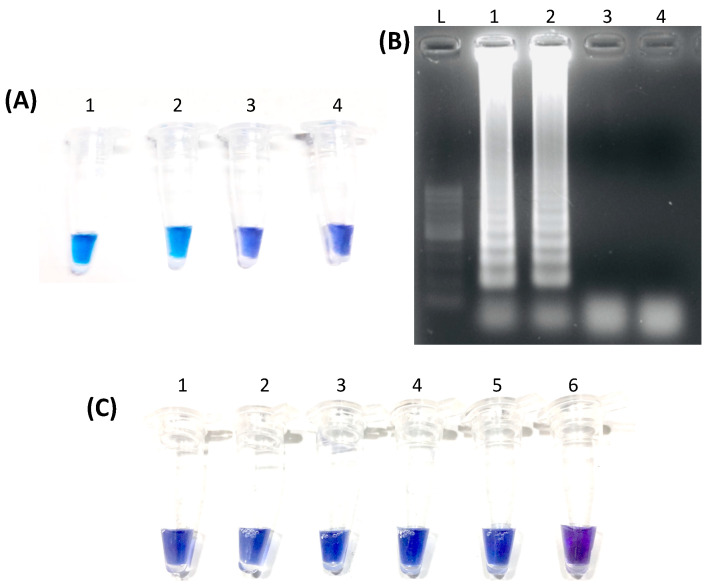
Figure 1.
Representative results of LAMP assay targeting E. canis gltA by direct visualization and after gel electrophoresis. (A) shows the results of selected samples under the established optimal condition through direct visualization wherein Tubes 1 and 2 show a blue color indicative of a positive reaction. In contrast, Tube 3 shows a violet color indicative of a negative reaction similar to the negative control (Tube 4). In (B), the same samples were subjected to gel electrophoresis and viewed over a UV transilluminator. Lanes 1 and 2 display multiple bands with a ladder-like appearance, similar to the DNA marker (L), whereas Lane 3 shows the absence of bands, similar to the negative control in Lane 4. (C) shows the test results for the detection limit using a purified PCR amplicon of E. canis gltA that was serially diluted 10-fold. Tube 1 has the highest number of template copies at 7.41 × 10⁹ while tube 5 has the lowest with 7.41 × 10⁴ copies. Tube 6 is the negative control.

