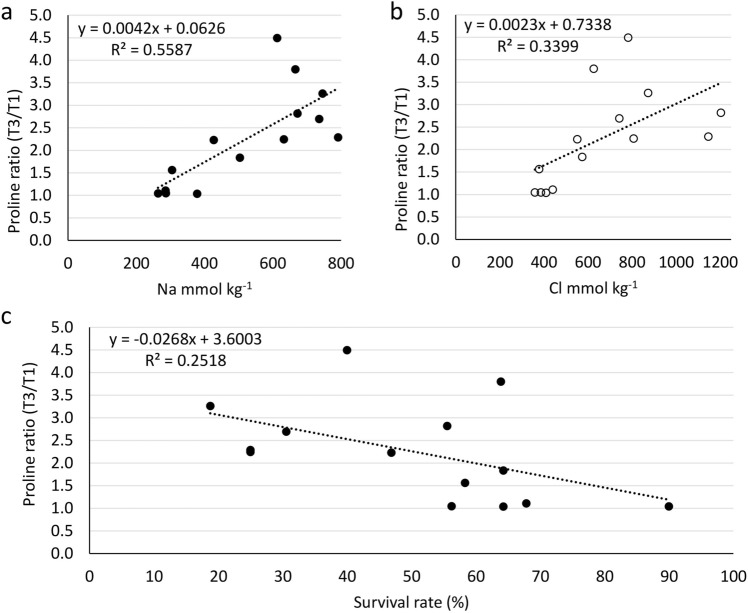
Figure 4.
Relationship of tissue proline concentrations with leaf Na and Cl concentrations and survival rate in 14 almond rootstocks. (a) The relationship between a ratio of proline concentration in Na–Cl dominant treatment and control (T3/T1) with leaf Na concentration. (b) The relationship between a ratio of proline concentration in Na-Cl dominant treatment and control (T3/T1) with leaf Cl concentration. (c) The relationship between a ratio of proline concentration in Na–Cl dominant treatment and control (T3/T1) with leaf Cl concentration. Dots represent mean values of different rootstocks, n = 3.

