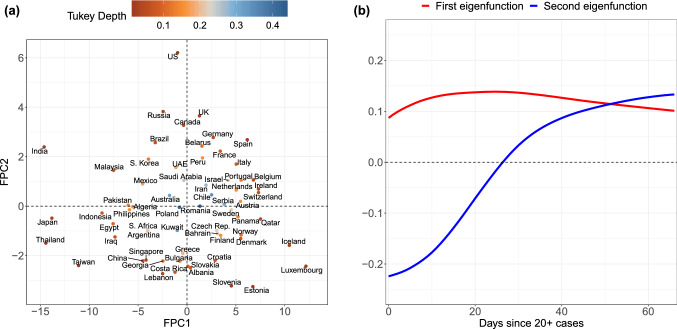
Figure 2.
Visualizing (a) the Functional Principal Component (FPC)-space representation of case trajectories, where coordinates represent the amount of deviation from the mean curve in the direction of (b) the first (red) and second (blue) eigenfunctions. The two-dimensional representation in FPC space captures 97% of the variation in the sample of case load trajectories across countries. Points are colored according to their Tukey depth, where higher depths indicate trajectories closer to the mean curve.

