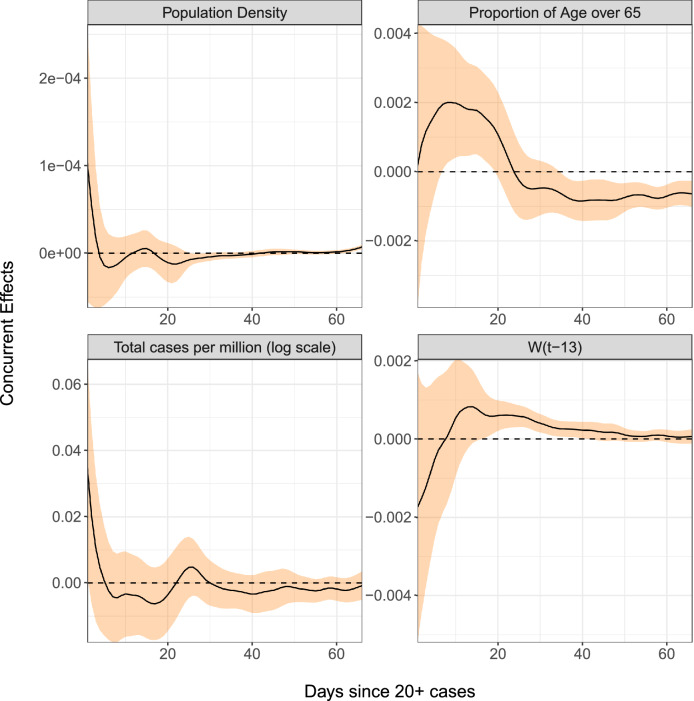
Figure 7.
Time-varying regression effects of population density, the fraction of population over age 65, total cases per million and the percentage of the reduction from baseline in workplace mobility patterns 13 days prior on doubling rate. The black curves are the concurrent effect functions and the orange ribbons represent 95% pointwise confidence bands. The variable represents the percent change in workplace mobility lagged by 13 days and is generally but not always negative.

