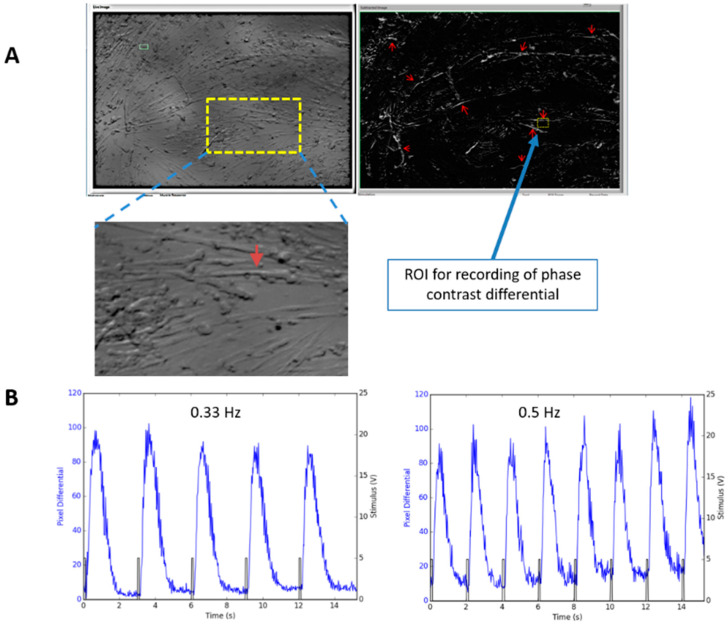
Figure 6.
Recording of myotube contraction by measuring pixel differentials under phase contrast microscope. (A) Recording of a myotube contraction in a Day 14 culture (D10 in Differentiation) was performed by motion capture of the myotubes using a custom LabVIEW program. Left image in A is a regular phase image. The right is a phase differential image in which all the contracting myotubes “light up” due to the phase contrast change caused by motions. Red arrows point to some of the contracting myotubes where synchronous motion was detected upon stimulation indicating they were contracting. An enlarged image of the recorded myotube was included as an inset. An ROI (Region of Interest) was chosen on one of the contractible myofibers for monitoring myofiber contraction under electrical stimulation. (B) Contraction recording from one myofiber under two stimulation frequencies are illustrated as an example.

