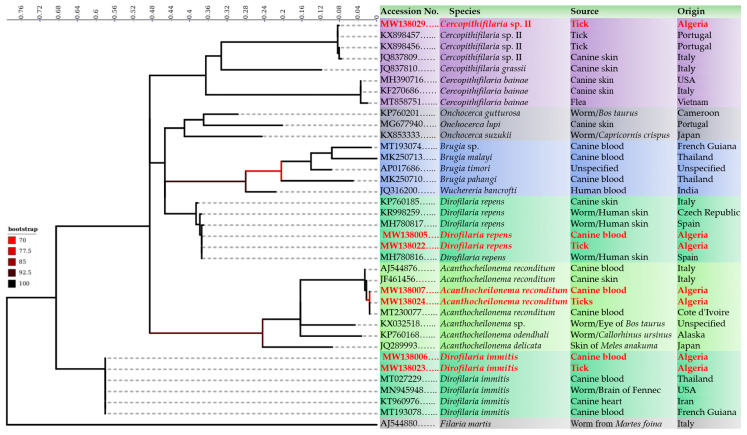
Figure 2.
Phylogenetic tree showing the clusterization of filarial genotypes identified in the present study with the other filarioids. The tree was inferred using the Maximum Likelihood method based on 1000 bootstraps and the Tamura-Nei model. The analysis involved 36 partials (453 bp) cox 1 sequences of filarioids. Outgroup taxons Filaria martis (AJ544880) is drawn at root. A discrete Gamma distribution was used to model evolutionary rate differences among sites (5 categories (+G, parameter = 0.5779)). The rate variation model allowed for some sites to be evolutionarily invariable ([+I], 49.5935% sites). Log likelihood was-2738.5083. The axis showed the global distance observed throughout the trees. The identity of each taxa is color-coded according to the genus. Branches are color-coded according to the bootstraps percent.

