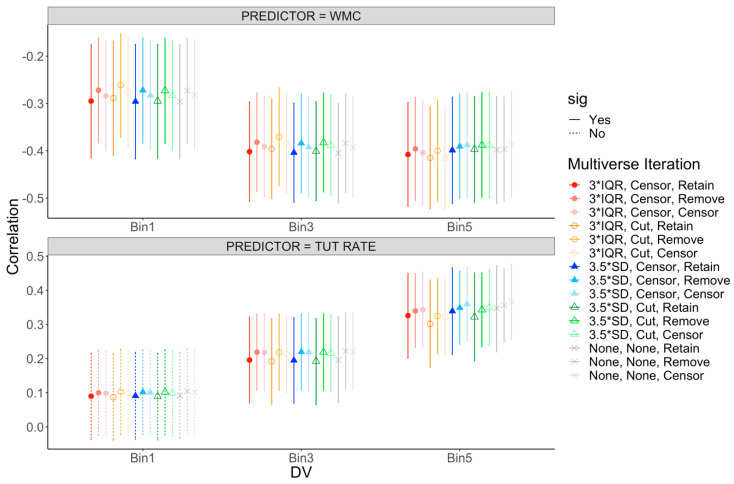
Figure 4.
Mini-multiverse of ranked-bin correlations. The top panel presents correlations with working memory capacity (WMC). The bottom panel presents correlations with rate of task-unrelated thought (TUT). Points reflect the correlation, with error bars representing the 95% confidence interval (CI) around the estimate. Circles represent iterations where outlying trials were defined by interquartile ranges (IQR), triangles represent iterations where outlying trials were defined by standard deviations (SDs), and xs represent iterations where no criteria were applied to outlying trials. Filled shapes reflect iterations where outlying trials were censored to the respective cutoff value before aggregating and open shapes reflect iterations where outlying trials were removed before aggregating. Colors presented in this figure match those illustrating the multiverse iterations in Figure 3. Solid CIs represent significant correlations, and dashed CIs represent non-significant correlations at p = 0.05.

