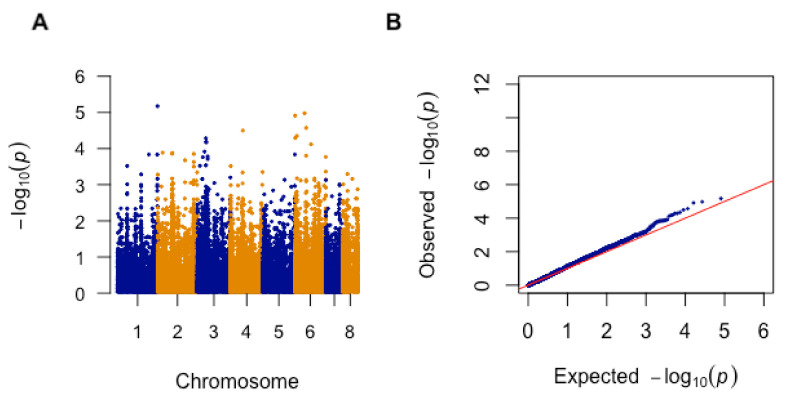
Figure 4.
(A) The Manhattan plot for AMB sensitivity of A. fumigatus isolates in Cluster 2 (n = 33). The plot is based on −log10(p-value) and chromosome position. (B) Quantile–quantile (Q–Q) plot from genome-wide association (GWA) analysis of AMB sensitivity. Comparison of observed −log10(p-value) to the expected −log10(p-value).

