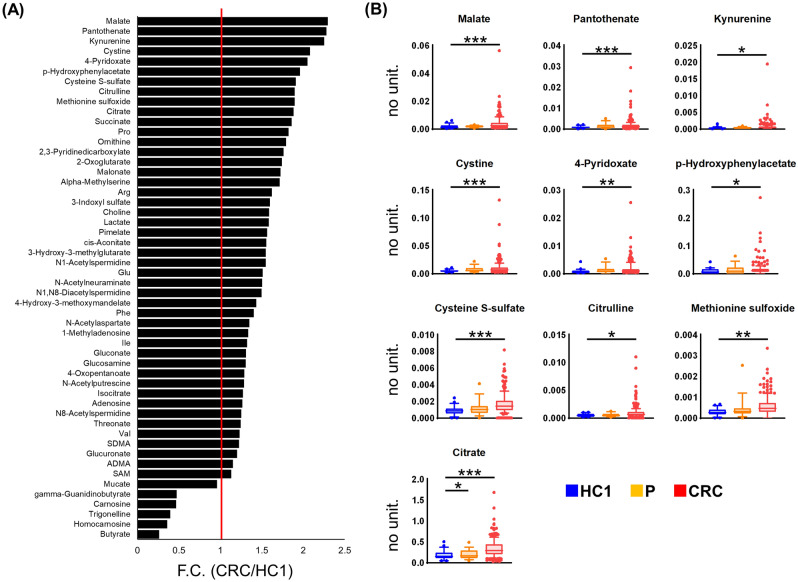
Figure 4.
The average fold change of metabolites with significantly different levels between healthy control 1 (HC1) and patients with colorectal cancer (CRC) (Mann–Whitney test; P < 0.05 adjusted by FDR) (A). The representative box plots of metabolite concentrations within the top tenfold change values (B). Metabolite concentrations are normalized to that of creatinine for each sample. The comparison among HC1, polyp (P), and CRC groups was performed using Kruskal–Wallis and Dunn’s post-tests. All metabolites shown here had P < 0.005 in the Kruskal–Wallis test, and ***, **, and * indicate P < 0.0001, P < 0.01, and P < 0.05 in the post-tests, respectively. GraphPad Prism (ver. 8.4.2, https://www.graphpad.com/) was used.

