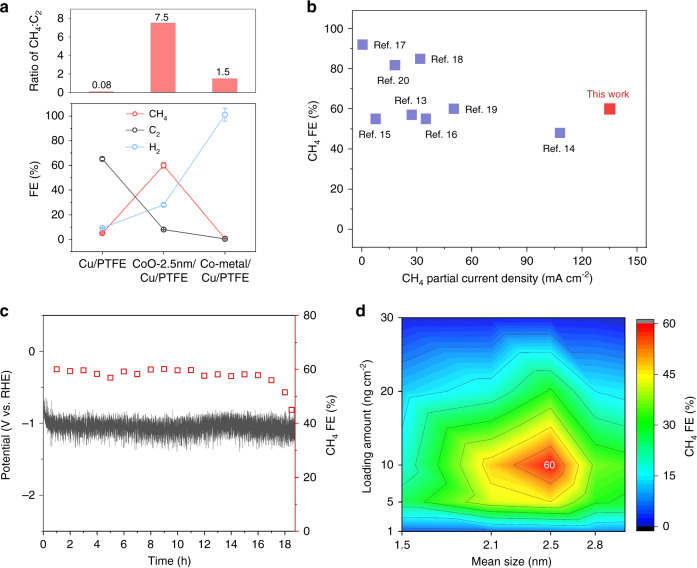
Fig. 3. Electrocatalytic performance of electrocatalysts.
a Product distribution of CoO/Cu/PTFE, Co metal/Cu/PTFE and bare Cu/PTFE at the −1.1 V vs. RHE. Red circle for methane, blue circle for hydrogen and grey circle for C2 products. b CO2-to-CH4 performance of CoO/Cu/PTFE in comparison with recent reports13–20. Blue square for the results in literature. c Stability test of CO2 methanation during 18.5 h of electrolysis under the current density of 225 mA cm−2. Red square for methane FE and grey line for potential curve. d CH4 FEs of ligand-stabilized CoO clusters with different sizes and loading contents on Cu/PTFE under an operating current density of 225 mA cm−2 in a flow cell using 1 M KHCO3 electrolyte.

