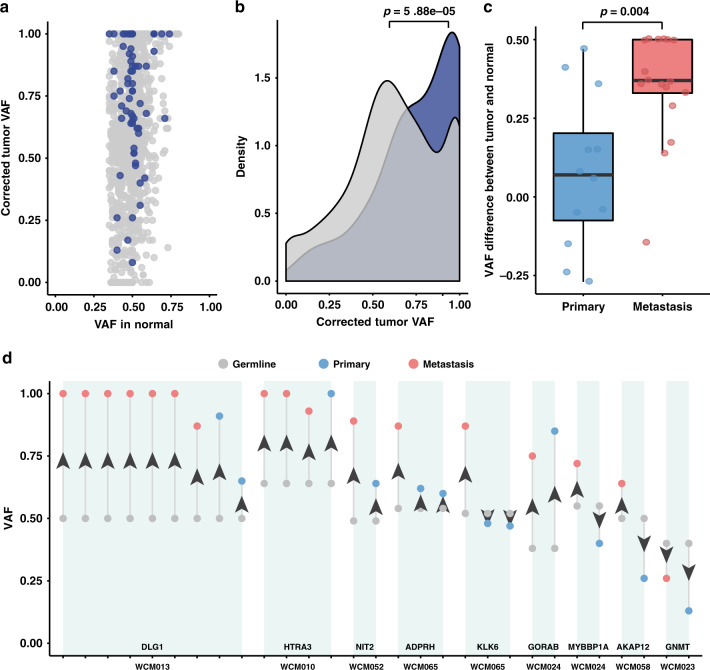
Fig. 5. Deepening loss of heterozygosity during UC progression.
a A scatter plot displaying the normal and tumor VAFs of pDGVs in TSGs (blue dots) and protein-truncating germline variants in non-TSGs (gray dots). The majority of pDGVs have a tumor-to-normal VAF ratio ≥1.6. b A density plot representing the distribution of the VAFs of pDGVs affecting TSGs and protein-truncating germline variants affecting non-TSGs. The peak density of the VAF of pDGVs in TSGs (blue) is significantly higher than the density of the VAF of protein-truncating germline variants in non-TSGs (gray) using a two-tailed Kolmogorov–Smirnov test. c The median VAF of pDGV is significantly higher in metastatic tumors (n = 17) compared to primary tumors (n = 12) in UC using a two-tailed Wilcoxon signed-rank test. The lower and upper edge of the box indicate the 25th and 75th percentiles. The black line in the center of the box indicates the median value; the lower and upper whiskers indicate 1.5x the interquartile range. d Changes in the VAFs of pDGVs in matched primary and metastatic UC trios. Metastatic, primary tumors, and germline are displayed in red, blue, and gray, respectively. Source data are provided as a Source Data file.

