Fig. 5.
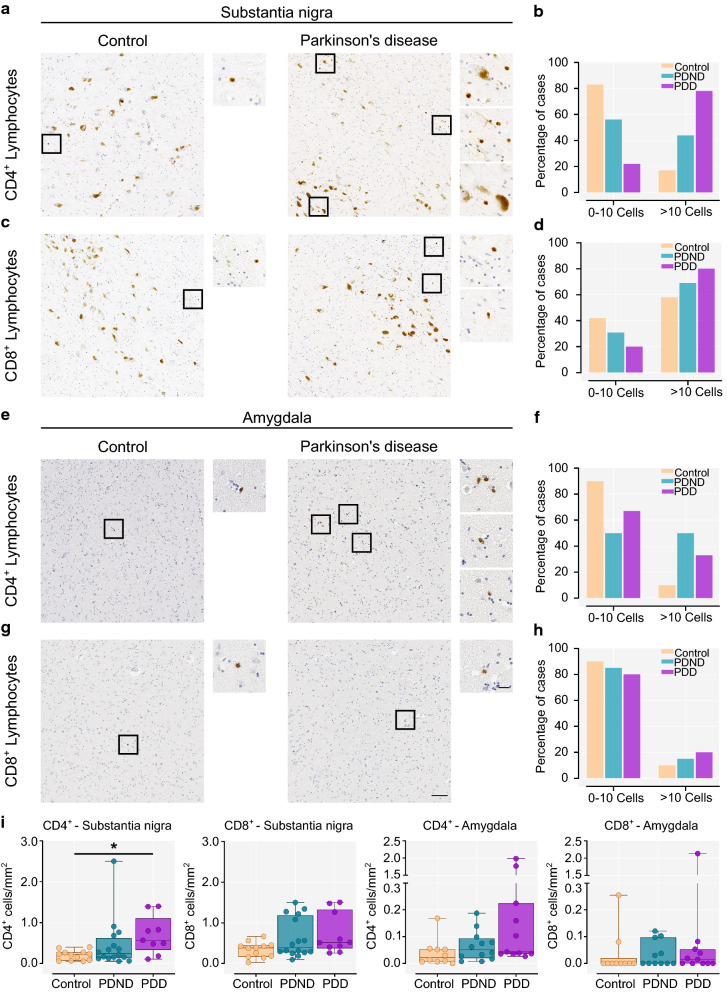
CD4+ and CD8+ T lymphocytes in the substantia nigra and the amygdala. a, c Representative image of parenchyma infiltrating CD4+ and CD8+ T lymphocytes in the substantia nigra of a control (left) and a Parkinson’s brain (right). The dark brown pigment is neuromelanin within dopaminergic neurons; the smaller CD4+ and CD8+ T cells are shown in the higher magnification inserts indicated by black squares. b, d Percentage of controls, PDND and PDD cases that show 0–10 or more than 10 infiltrating CD4+ (χ2 = 75.15, p < 0.0001) or CD8+ T cells (χ2 = 11.31, p = 0.0035) in the entire nigral section e, g Representative image of parenchyma infiltrating CD4+ and CD8+ T lymphocytes in the amygdala of a control (left) and a Parkinson’s brain (right). CD4+ and CD8+ T cells are shown in the higher magnification inserts indicated by black squares. f, h Percentage of controls, PDND and PDD cases that show 0–10 or more than 10 infiltrating CD4+ (χ2 = 37.68, p < 0.0001) or CD8+ T cells (χ2 = 3.92, p = 0.141) in the entire amygdala section. i Quantification of parenchymal CD4+ (p = 0.023, Control vs PDD p = 0.018) and CD8+ T lymphocytes (p = 0.102) per mm2 in the substantia nigra. Control n = 12, PDND n = 16, PDD n = 10. Quantification of parenchymal CD4+ (p = 0.081) and CD8+ T lymphocytes (p = 0.434) per mm2 in the amygdala. Control n = 10, PDND n = 12, PDD n = 11. Kruskal–Wallis with Dunn’s multiple comparisons test. PDND Parkinson’s disease no dementia, PDD Parkinson’s disease dementia. Scale bar: 100 μm. Scale bar (insert): 20 μm. *p < 0.05

