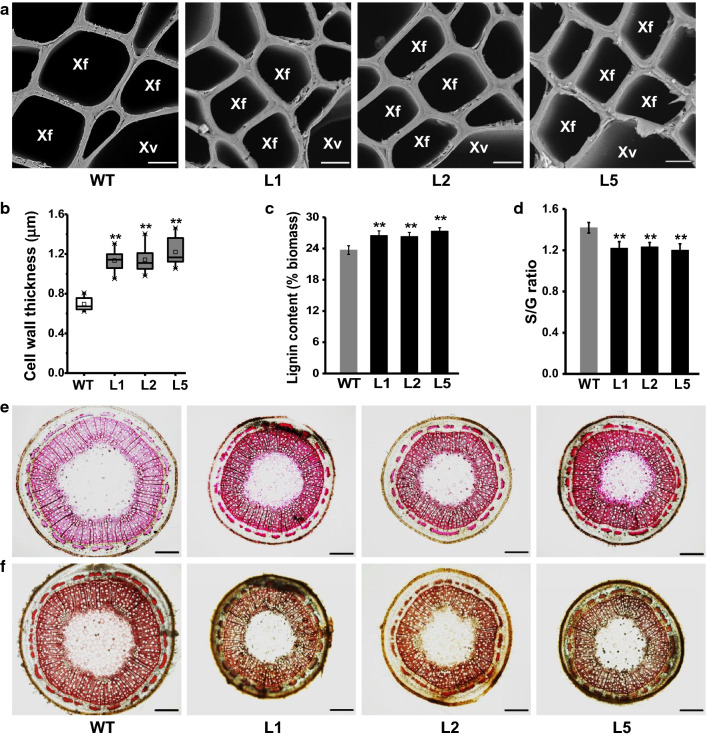
Fig. 3.
Observations of plant cell walls in PtoLAC14-OE transgenic poplar plant. a Scanning electron microscopy (SEM) images (Xy: xylem, Xf: xylem fiber cells, Xv: xylem vessel. Scale bar is 10 μm). b Cell wall thickness of SEM observation. c Lignin content (% biomass). d The monomer lignin S/G ratio. e Phloroglucinol–HCl staining of stem cross sections from WT and PtoLAC14-OE lines. f Mäule staining for lignin monomer composition of stem cross sections from WT and PtoLAC14-OE lines. Scale bars are 100 μm in e and f. All data as means ± SD (n = 30 in b, n = 3 in c and d). Student’s t-test was performed between the transgenic line and WT as **P < 0.01

