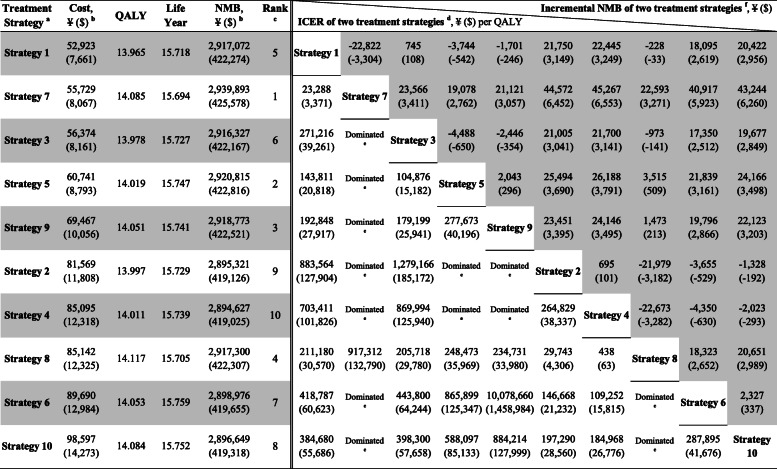
Table 2.
Base-case results: cost-effectiveness of 10 pharmacologic combination strategies and strategy ranking (per patient)
Strategy 1: metformin → metformin + sulfonylurea → metformin + insulin. Strategy 2: metformin → metformin + sulfonylurea → metformin + GLP-1 receptor agonist. Strategy 3: metformin → metformin + thiazolidinedione → metformin + insulin. Strategy 4: metformin → metformin + thiazolidinedione → metformin + GLP-1 receptor agonist. Strategy 5: metformin → metformin + α-glucosidase inhibitor → metformin + insulin. Strategy 6: metformin → metformin + α-glucosidase inhibitor → metformin + GLP-1 receptor agonist. Strategy 7: metformin → metformin + glinide → metformin + insulin. Strategy 8: metformin → metformin + glinide → metformin + GLP-1 receptor agonist. Strategy 9: metformin → metformin + DPP-4 inhibitor → metformin + insulin. Strategy 10: metformin → metformin + DPP-4 inhibitor → metformin + GLP-1 receptor agonist
DPP-4 dipeptidyl peptidase 4, GLP-1 glucagon-like peptide 1, ICER incremental cost-effectiveness ratio, NMB net monetary benefit, QALY quality-adjusted life-year
aThe treatment strategies were presented in the order of ascending costs in this table. Detailed results of the 10 pharmacologic combination strategies were shown in Additional file 1: Table S8
bFor the costs, data are 2019 Chinese yuan, ¥ (2019 US dollar, $). One US dollar was equal to ¥6.908 in 2019 [31]
cThe strategies were ranked based on both the ICERs and the NMBs. The strategy ranking process based on the ICERs was presented in Additional file 1: Table S7. The larger the NMB value, the more cost-effective the strategy is. The ranking results based on the ICERs were equal to that based on the NMBs
dResults of the ICER of two treatment strategies are presented in the triangle area in the lower left corner of the table. The data indicate row-to-column differences; for example, the ICER of strategy 7 vs. strategy 1 is ¥23,288 ($3371)/QALY
e“Dominated” indicates a strategy (row) that is more costly and less effective than its comparator (column); for example, strategy 3 is dominated by strategy 7
fResults of the incremental NMB of two treatment strategies are presented in the triangle area in the upper right corner of the table (gray area). The data indicate row-to-column differences; for example, the incremental NMB of strategy 1 vs. strategy 7 is − ¥22,822 (− $3304)

