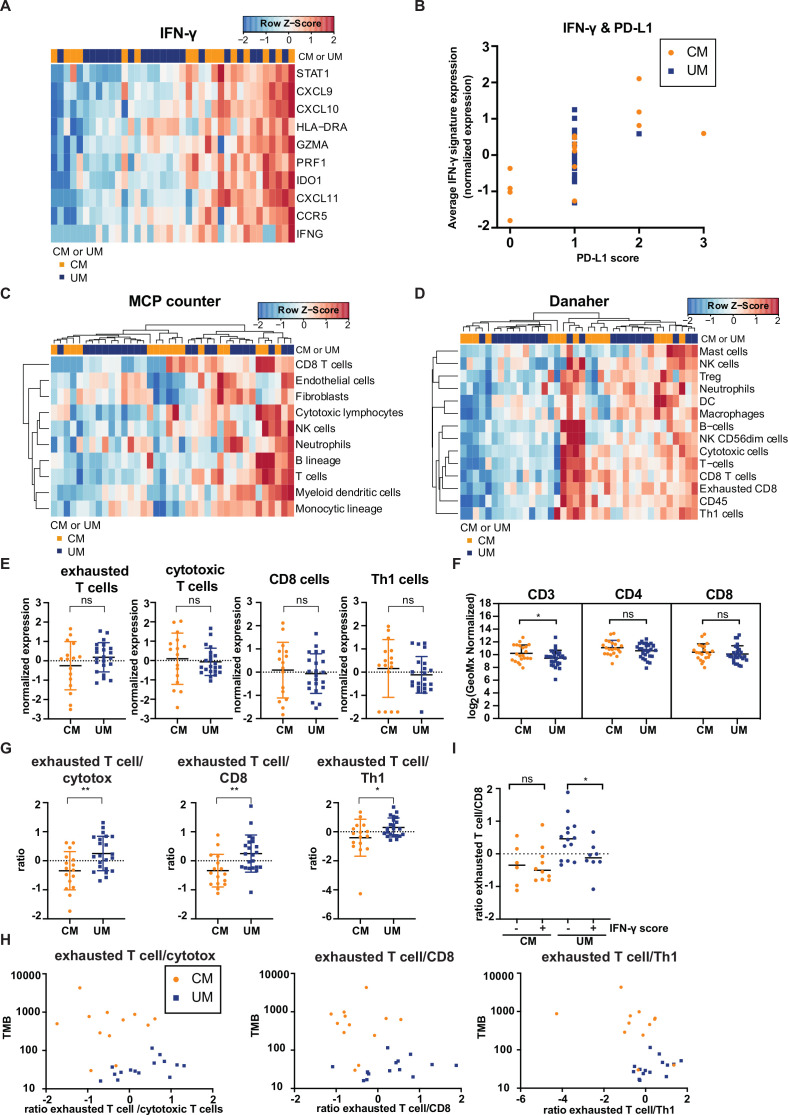
Figure 3.
Comparison of immune cell infiltration of cutaneous melanoma (CM) and uveal melanoma (UM) liver metastases. Heatmaps of the gene signatures (A) interferon-gamma (IFN-γ)35 (C) microenvironment cell population (MCP) counter36 and (D) Danaher immune cell signature.37 Columns represent patients (CM patients (orange); UM patients (blue). Hierarchical clustering of the gene signatures is displayed MCP counter and Danaher immune cell signature.) and rows genes. Positive values (red) are indicated as higher expression, negative values (blue) are indicated as lower expression. (B) Programmed cell death ligand 1 expression (quantified by immunohistochemistry) and average expression of IFN-γ gene signature for CM (orange) and UM (blue) patients. (E) Normalized expression of immune cell subsets of the Danaher immune cell signature for CM and UM liver metastases, displaying the mean and SD. (F) Digital spatial analysis of CM and UM liver metastases for CD3, CD4 and CD8 expression. The mean and SD are shown. (G) The ratio of immune cell subsets values of the Danaher immune cell signature. The mean and SD are shown. (H) Non-synonymous tumor mutational load (TMB) and ratio of immune cell subsets of panel (G) for CM (orange) and UM (blue) patients. (I) IFN-γ score (positive (+) or negative (−) average expression of IFN-γ gene signature expression) and ratio of exhausted T cells to CD8 T cells (defined by the Danaher immune cell signature) for CM (orange) and UM (blue) patients. The median is shown. The statistical differences of the different immune cell infiltration were compared through independent t-test. ns p>0.05, *p≤0.05, **p≤0.01.

