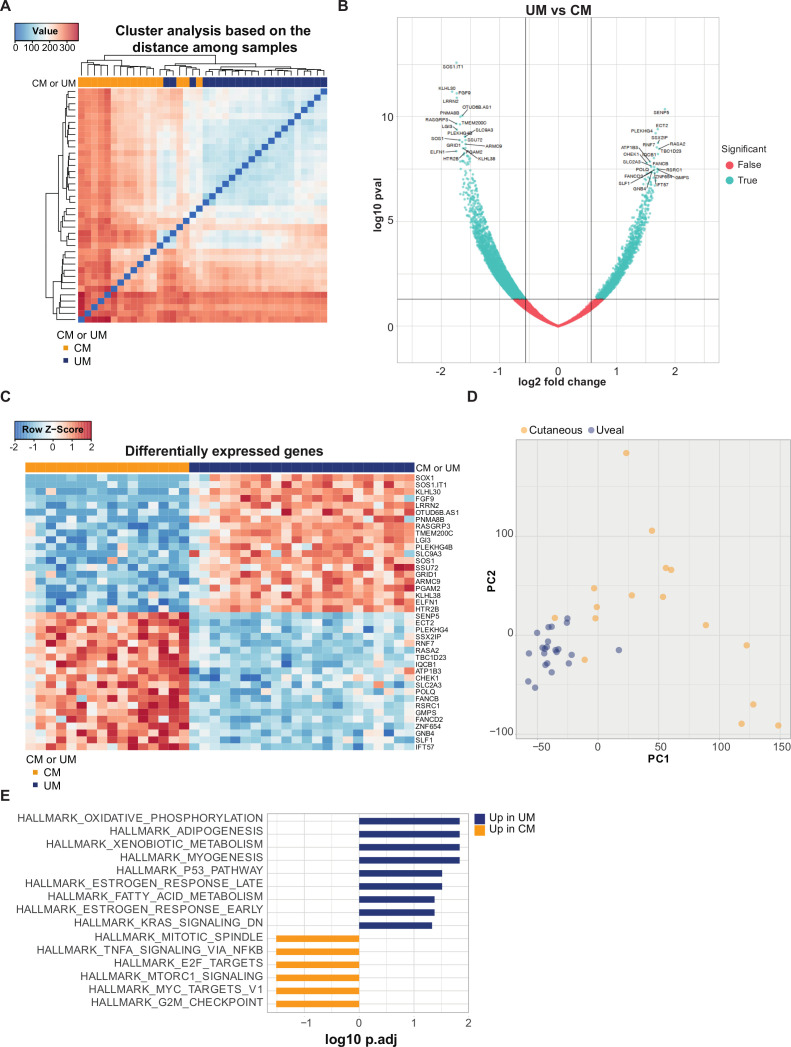
Figure 4.
Transcriptional profile of cutaneous melanoma (CM) and uveal melanoma (UM) liver metastases. (A) Distance matrix with hierarchical clustering of CM (orange) and UM (blue) patient sample. (B) Volcano plot of differentially expressed genes (DEGs), showing 6523 significant genes (p≤0.05) in blue and p>0.05 in red. Left: genes higher expressed in UM; right: genes higher expressed in CM. (C) Heatmap based on the top 20 most significant DEGs higher in CM (orange) and UM (blue). Positive values (red) are indicated as higher expression, negative values (blue) are indicated as lower expression. (D) Comparison of CM and UM samples by principle component analysis, showing PC1 and PC2. CM in orange dots, UM in blue dots. (E) Gene set enrichment analysis of DEGs between CM (orange) and UM (blue) patient samples, ordered according to the false discovery rate (FDR), in which the pathways with an FDR<0.05 are shown.

