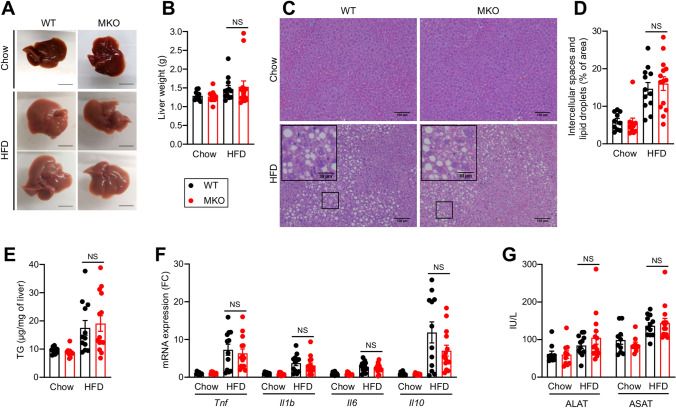
Figure 3.
Effect of RORα deletion in macrophages on liver upon HFD feeding. Ten weeks old WT and MKO mice were fed with either a chow or a HFD for 12 weeks. (A) Representative liver gross morphology. (B) Liver weight. (C, D) Hematoxylin & Eosin staining of liver sections (C) and quantification of lipid droplets (D). Images were acquired on an Eclipse Ti-U microscope (Nikon) and quantified with Image J version 1.51j8 software (NIH, https://imagej.nih.gov/ij/). (E) Hepatic triglycerides (TG) content. (F) mRNA expression levels measured by RT-qPCR for Tnf, Il1b, Il6, and Il10 genes in liver. (G) Plasma transaminases activity. Data are shown as mean ± SEM. 2-way ANOVA followed by Sidak’s multiple comparisons test was performed. All statistical analyses were carried out using GraphPad Prism 8 for Windows (GraphPad Software). n = 10–15 mice per group. NS: Not significant; FC: Fold Change. See also Fig. S3.

