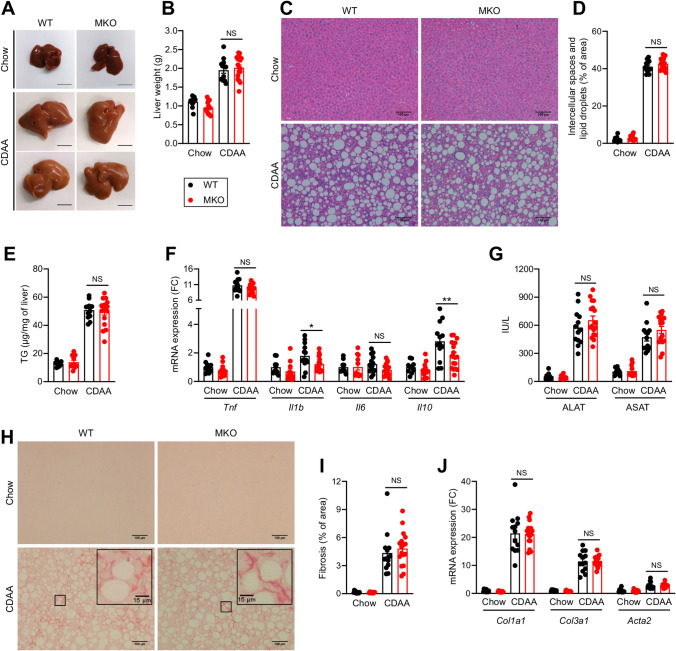
Figure 4.
Effect of RORα deletion in macrophages on liver upon CDAA diet feeding. Ten weeks old WT and MKO mice were fed with either a chow or a CDAA diet for 8 weeks. (A) Representative liver gross morphology. (B) Liver weight. (C,D) Hematoxylin & Eosin staining of liver sections (C) and quantification of lipid droplets (D). Images were acquired on an Eclipse Ti-U microscope (Nikon) and quantified with Image J version 1.51j8 software (NIH, https://imagej.nih.gov/ij/). (E) Hepatic triglycerides (TG) content. (F) mRNA expression levels measured by RT-qPCR for Tnf, Il1b, Il6, and Il10 genes in liver. (G) Plasma transaminases activity. (H,I) Sirius red staining of liver sections (H) and quantification of fibrosis (I). Images were acquired on an Eclipse Ti-U microscope (Nikon) and quantified with Image J version 1.51j8 software (NIH, https://imagej.nih.gov/ij/). (J) mRNA expression levels measured by RT-qPCR for Col1a1, Col3a1, and Acta2 genes in the liver. Data are shown as mean ± SEM. *p < 0.05 by 2-way ANOVA followed by Sidak’s multiple comparisons test. All statistical analyses were carried out using GraphPad Prism 8 for Windows (GraphPad Software). n = 10–17 mice per group. NS: Not significant; FC: Fold Change. See also Fig. S4.

