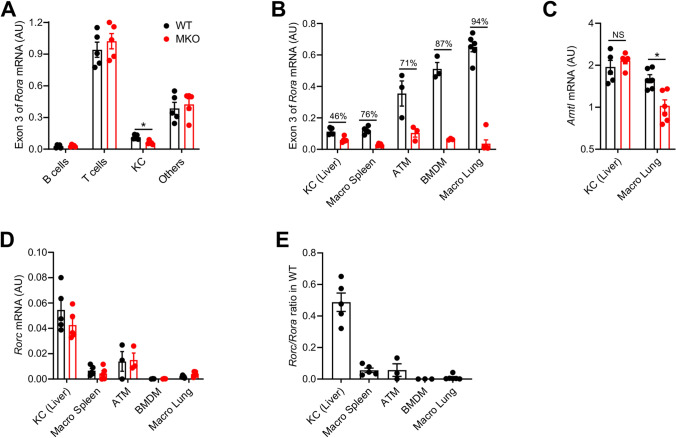
Figure 5.
Impact of RORα deletion on Kupffer Cells (KCs). (A,B) mRNA expression levels measured by RT-qPCR for the exon 3 of Rora gene in B cells, T cells, KCs, and CD45+ non T, B or KC (others) sorted from liver (A) and in different macrophage populations (B) from WT and MKO mice fed with chow diet. (C,D) mRNA expression levels measured by RT-qPCR for Arntl (C) and Rorc (D) genes in different macrophage populations. (E) Rorc/Rora ratio in different macrophage populations from WT mice. Data are shown as mean ± SEM. *p < 0.05 by 2-way ANOVA followed by Sidak’s multiple comparisons test. All statistical analyses were carried out using GraphPad Prism 8 for Windows (GraphPad Software). n = 3–6 mice per genotype except for ATM where each dot represents a pool of 3–4 mice. NS not significant, AU arbitrary unit. See also Fig. S5.

