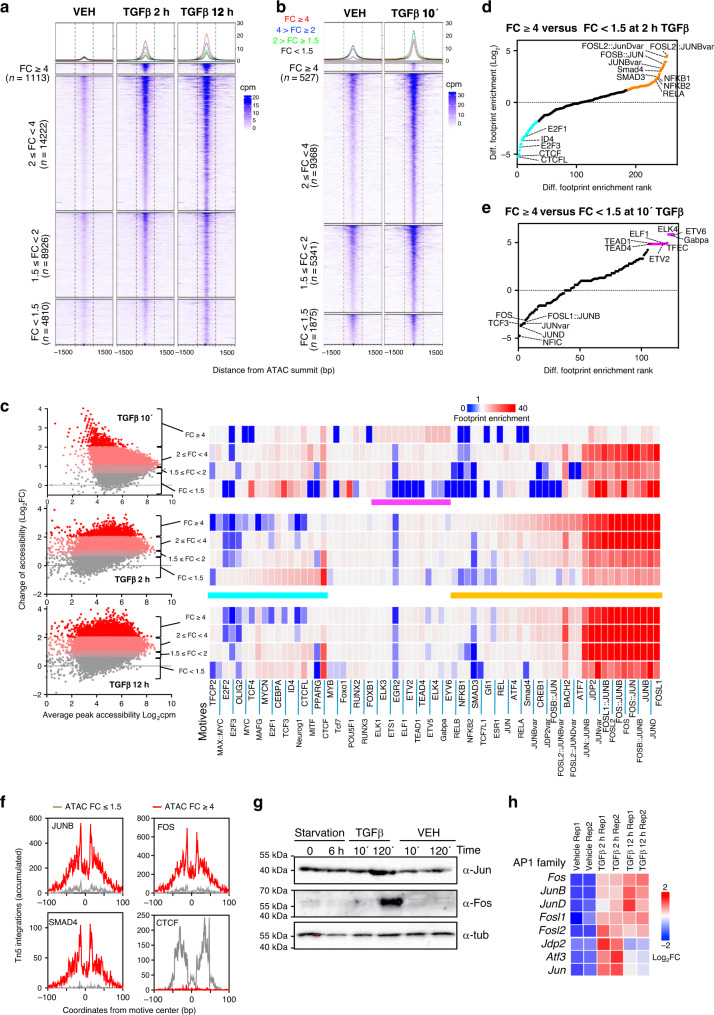
Fig. 2. ATAC-seq analysis of TGFβ-treated cells.
a, b Heatmaps showing alignment of ATAC-seq peaks signal from cells treated with vehicle, or TGFβ for 2 h or 12 h (a) or with vehicle or TGFβ for 10 min (b). Peaks are divided into four categories (FC < 1.5, 1.5 ≤ FC < 2, 2 ≤ FC < 4 and FC ≥ 4) based in change of ATAC-seq signal between TGFβ and vehicle for 2 h (a) or for 10 min (b). c TF occupancy depending on changes in accessibility at the indicated timepoint. Left: scatter plot of changes of ATAC-seq signal (y-axis, log2FC) versus average signal (x-axis). ATAC-seq peaks were divided into four categories according to FC as in (a and b). Right: TF genomic footprints enrichments were determined in the indicated category of ATAC-seq peaks. TF footprints were determined by calculating the protection from transposition observed in the ATAC-seq signal. TF motifs (from JASPAR) were identified in footprinted regions. Seventy of 550 are shown. d, e Differential footprint enrichment between FC ≥ 4 and FC < 1.5 of TGFβ or vehicle for 2 h (d) or for 10 min (e). Dots correspond to the same colored bars in c. f Example of TF footprint profile at 2 h after TGFβ. Accumulated Tn5 integrations (y-axis) along the indicated TF binding sites at nucleotide resolution (x-axis, bp from center of each TF motif) in ATAC peaks with FC ≥ 4 (red) and FC < 1.5 (gray). g Western blotting showing levels of Jun and Fos proteins under the indicated conditions. A representative image out of three independent biological replicates is shown. h Heatmap showing changes of mRNA levels by RNA-seq (log2FC) of genes encoding members of the AP-1 family. Source data are provided as a Source Data file.

