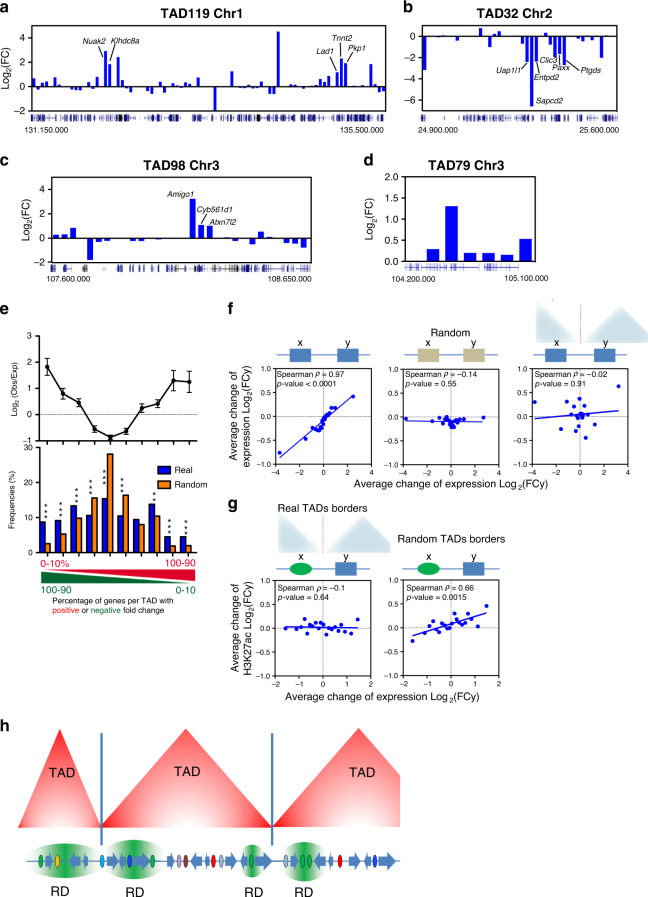
Fig. 7. TRDs Differ from TADs but are Constrained by TAD Borders.
a–d Changes of mRNA levels (2 h TGFβ versus vehicle) of genes contained at the indicated TADs. Co-regulated genes at TRDs are shown. e Top panel: ratio of observed versus expected frequencies of TADs with distinct proportions of genes with upregulated or downregulated FC (FC > 1 or FC < 1; 2 h TGFβ versus vehicle). Values are means ± SD. Bottom: histogram of the frequencies of TADs for the observed (blue) or randomized (orange) position of genes. TADs (n = 688) were binned into ten intervals depending on the percentage of up- versus downregulated genes. Significance was determined by comparing the real value with 500 randomizations of the gene order (see Methods). Probabilities (p) of the real number considering Normal distribution are provided. **p ≤ 0.001; ***p ≤ 0.0001. Exact p-values are provided in Supplementary Data 5. Data for 12 h are given in Supplementary Fig. 15 c. f Correlation between change of expression (12 h TGFβ versus vehicle) of every pair of expressed contiguous genes (x, y) of the genome using real chromosomal order (left), random gene order (middle) or pairs of contiguous genes separated by a TAD border (right). Spearman correlation coefficient and p-values are shown. Data were binned into 20 intervals. Data for 2 h are given in Supplementary Fig. 15d. g Correlation plot between change of H3K27ac signals of enhancers (ChIP-seq signal 2 h TGFβ versus vehicle) and change of mRNA level (RNA-seq signal 2 h TGFβ versus vehicle) of their closest gene separated by real (left), or by random TAD borders (right). Data were binned into 20 intervals. Data for 12 h are given in Supplementary Fig. 15e. h Model of influence of TGFβ-regulatory domains (TRD) and other regulatory domains (RD) constrained by the insulating activity of TAD borders. Small TADs can harbor a single RD. Source data are provided as a Source Data file.

