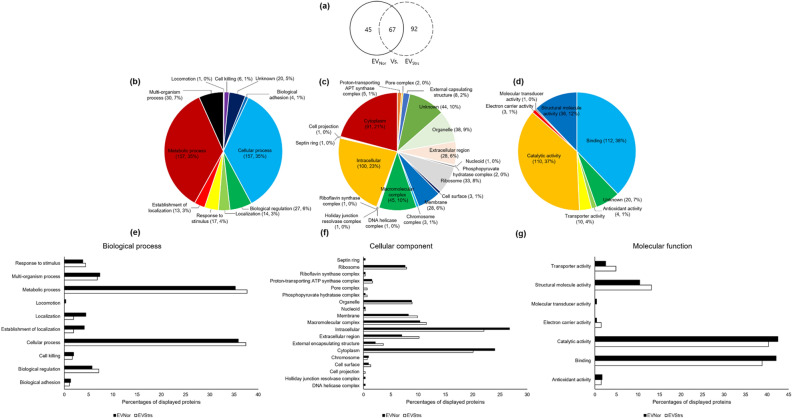
Figure 7.
Venn diagrams show the entire proteins identified from EVNor and EVStrs searched against the uni_bacteria database while the bar graphs classify the proteins which showed differential expression in EVNor and EVStrs. (a) A total of 204 proteins were established in EVNor (112 Proteins) and EVStrs (159 Proteins) together. Entire proteins were classified depending on the related biological process (b), cellular component (c), and molecular function (d). The percentages of displayed EVNor (black) and EVStrs (white) proteins were compared with respect to the consistent biological process (e), cellular component (f), and molecular function (g).

