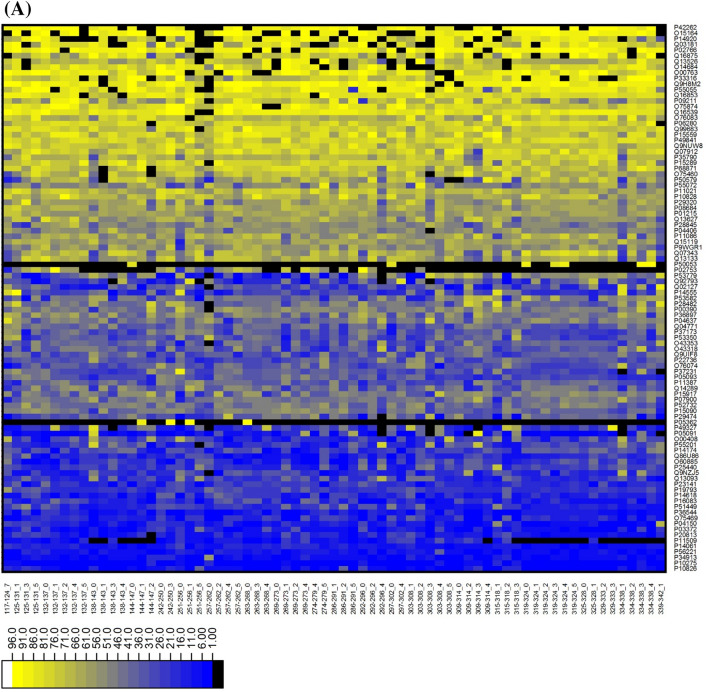
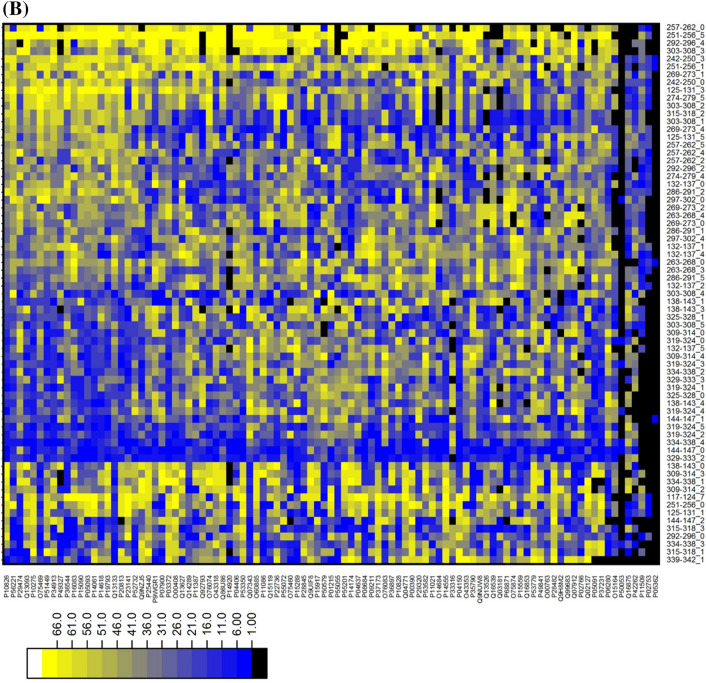
Figure 3.
Docking based TR screening result. Heatmap show ranking of TR pairs. (A) The ranking of targets (97) against ring systems from docking based TR screening. The x-axis and y-axis represent the Ring ID, Target ID respectively. The ranking of targets are shown by color palette pattern with different color intensity. The higher raking targets are shown as dark blue and lowest raking with yellow color. (B) The ranking of ring systems (69) against targets from docking based TR screening. The x-axis and y-axis represent the Ring ID Target ID, respectively. The ranking of ring systems are shown by color palette pattern with different color intensity. The higher raking targets are shown as dark blue and lowest raking with yellow color.


