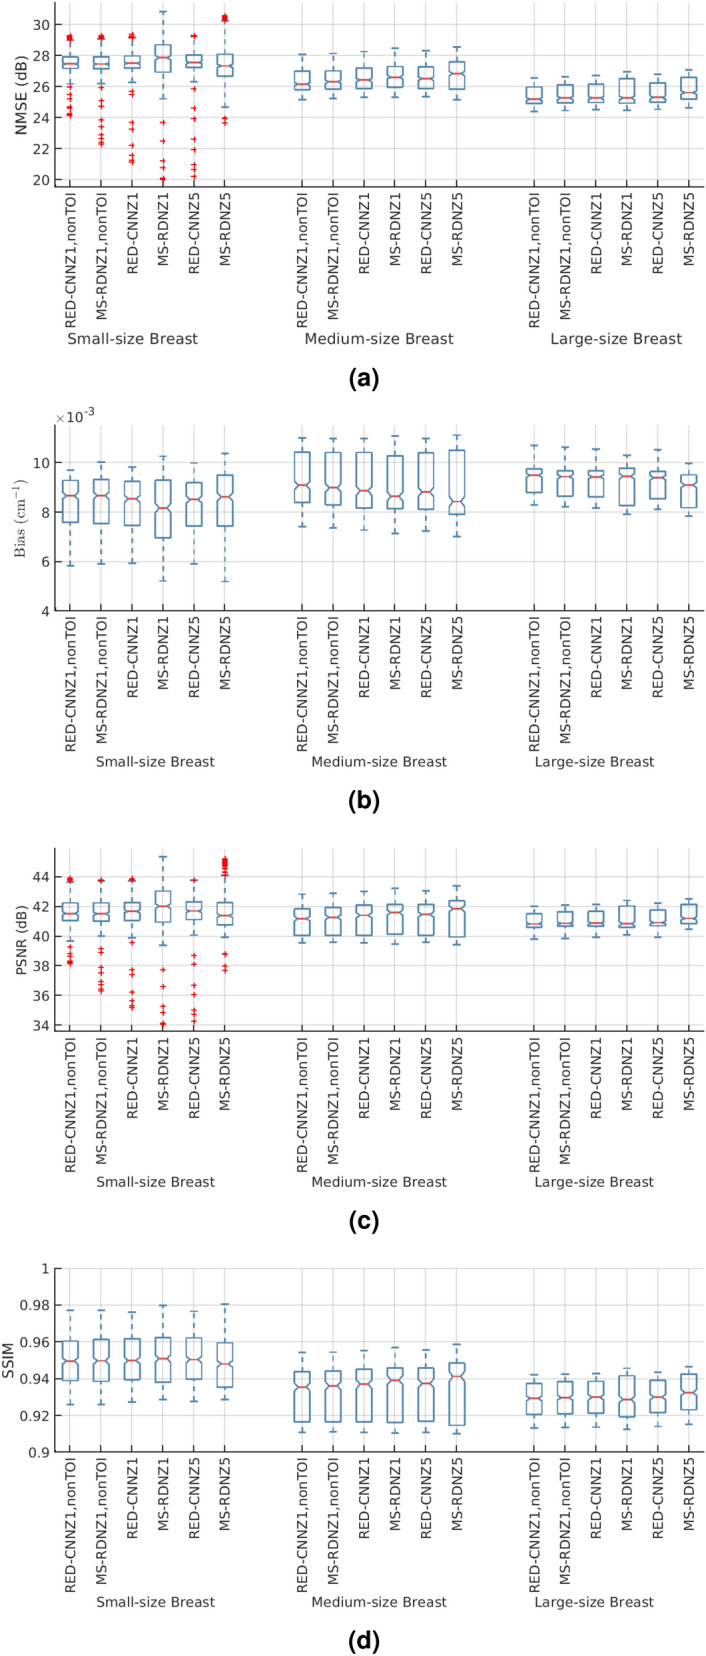
Figure 4.

The boxplots of (a) NMSE, (b) bias, (c) PSNR, and (d) SSIM for the reconstructions obtained using RED-CNN and MS-RDN with the following configurations: single slice training without TOI oriented patch extraction (, nonTOI), single slice training (), and multi-slice training (). For example, “MS-RDNZ1” represents MS-RDN with single slice training. On each box, the central mark is the median, the top and bottom are the 25th and 75th percentiles respectively. Outliers are denoted as red plus signs. Note that, in each breast-size group, MS-RDN and RED-CNN with the same configurations are placed next to each other for comparison.
