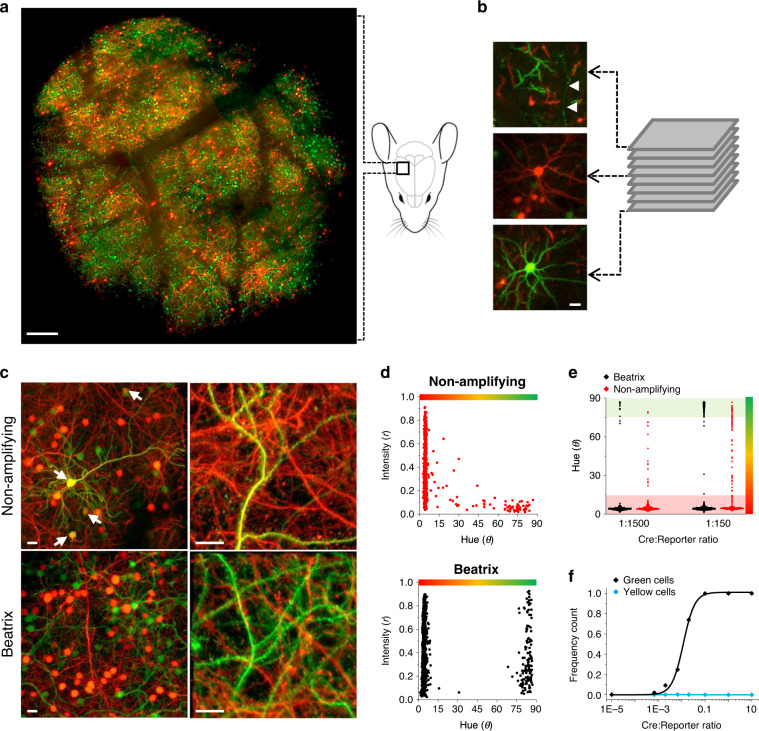
Fig. 2. In vivo expression mosaics induced with Beatrix or with a conventional reporter.
a Wide-field mosaic showing the entire area enclosed by the cranial window. The image obtained at P30 is a composite maximum projection of a stack imaged every 10 μm from the surface down to about 250 µm depth. Scale bar 200 µm. b Details relative to fields placed at 25, 130, and 230 µm depth. White arrowheads point to a superficial axon in layer 1 running through a field of apical dendrites. Scale bar 20 µm. c Representative fields of expression mosaic obtained with a Cre:Reporter ratio of 1:150. Arrowheads indicate cell bodies expressing both RFP and GFP that are frequent in the mosaic obtained without Cre amplification. In absence of amplification, dendrites show a uniform co-localization of GFP and RFP, which is absent in presence of amplification. Scale bar 20 µm. d Cumulative data obtained from n = 4 mice transfected with Beatrix and Cre at the 1:150 ratio (864 neurons) and from n = 3 mice transfected with a non-amplifying reporter and Cre (609 cells); these plots show the effect of the amplification on binarization (polar angle θ) and mean fluorescence intensity (radial distance r). In absence of amplification, the strong negative correlation between intensity and hue is confirmed by Pearson correlation coefficient R = −0.45 (two-sided F-test of overall significance for linear regression p < 10−4). The fluorescence intensity of the recombined cells is larger and more broadly distributed with Beatrix (p < 0.01, two-sided Kolmogorov-Smirnov test). e Scatterplot showing the difference in hue variation upon a tenfold dilution of the Cre controller using either Beatrix or the non-amplifying reporter. Cells show a very strong binarization only in presence of amplification. 1:1500 ratio (n = 3 mice per group), 1:150 ratio (n = 4, Beatrix; n = 3 control). f Frequency count of cells expressing only GFP (black) or both RFP and GFP (cyan) as a function of the Cre:Beatrix plasmid ratio. The number of yellow cells is negligible for every Cre:Beatrix plasmid ratio. Each point expresses mean ± SEM of all animals for that condition and its standard error; n = 3–4 animals per point, each one 300–500 acquired cells.

