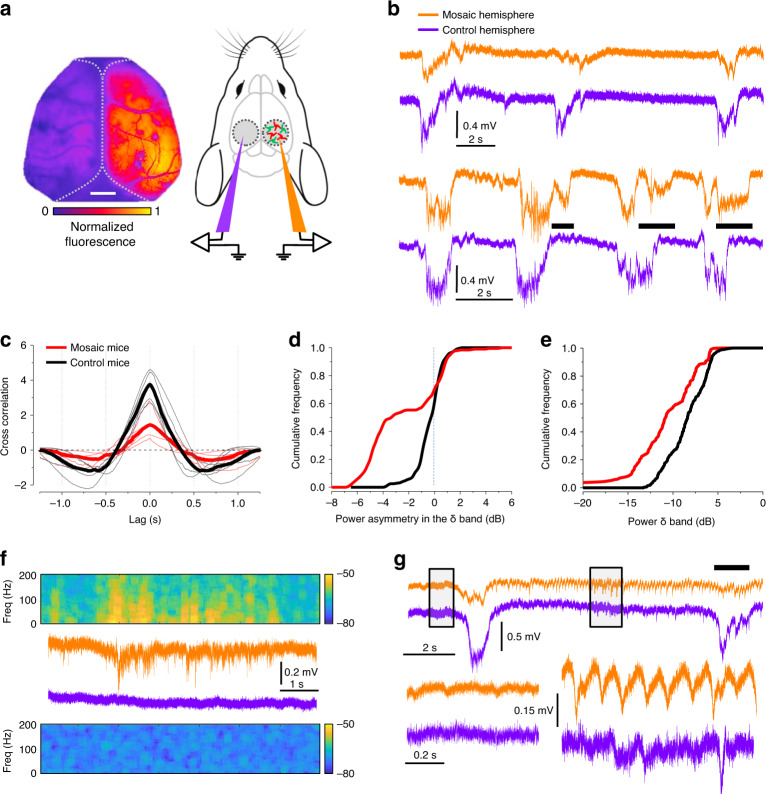
Fig. 6. Electrophysiological impairment of the resting state EEG in the PTEN-KO mosaic.
a LFP is recorded at the center of the PTEN mosaic, as identified by wide-field imaging of Beatrix fluorescence (scale bar 1 mm), and in the corresponding site in the contralateral hemisphere in layers 2/3. b SWO recorded in the PTEN mosaic and in the control site in two different mice. The data show two forms of SWO anomaly: in the upper example, the PTEN mosaic exhibits a large reduction in amplitude, in the lower example, the amplitude is normal, but the timing of the oscillation is altered with long tails of activity (black bars). c The loss of interhemispheric synchrony is demonstrated by the cross-correlation spectra of the LFP recorded in the two hemispheres of control and PTEN mosaic mice (n = 6 control mice, n = 6 mosaic mice). Each thin line reports the spectra of an individual mouse and the thick line is the median spectra. The two groups of spectra are significantly different (p < 0.05, two-sided Mann–Whitney U test). d Power difference in the delta band (0.5–4 Hz) between the two channels for the entire sample (p < 0.01, two-sided Kolmogorov–Smirnov test). e The amplitude of upstates in the control side of mosaic mice is impaired as demonstrated by the lower power measured in the δ band of individual oscillations (p < 0.01, two-sided Kolmogorov-Smirnov test). f Epileptiform burst occurring in the PTEN mosaic during a downstate. g Epileptiform burst formed by regular hypersynchronous spikes occurring in the PTEN mosaic. The dashed boxes indicate the areas magnified below. On the left, it can be appreciated how physiological down states are devoid of any significative activity. During the burst, however, the mosaic side exhibits periodic sharp spikes occurring at a frequency of about 5–10 Hz. These bursts are never observed in control mice. This activity suppresses regular SWO in the PTEN mosaic (black bar).

