Figure 5:

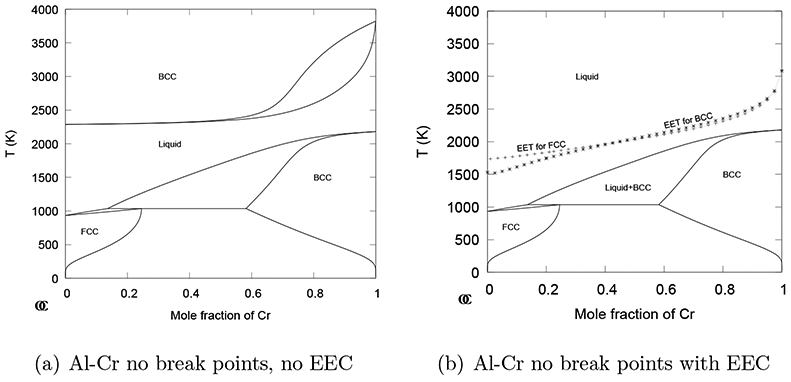
(a) The Al-Cr phase diagram without break points for pure Al and Cr and without the EEC. (b) The same diagram calculated with the EEC and with the EET for fcc (+) and bcc (*) plotted inside the liquid range.

(a) The Al-Cr phase diagram without break points for pure Al and Cr and without the EEC. (b) The same diagram calculated with the EEC and with the EET for fcc (+) and bcc (*) plotted inside the liquid range.