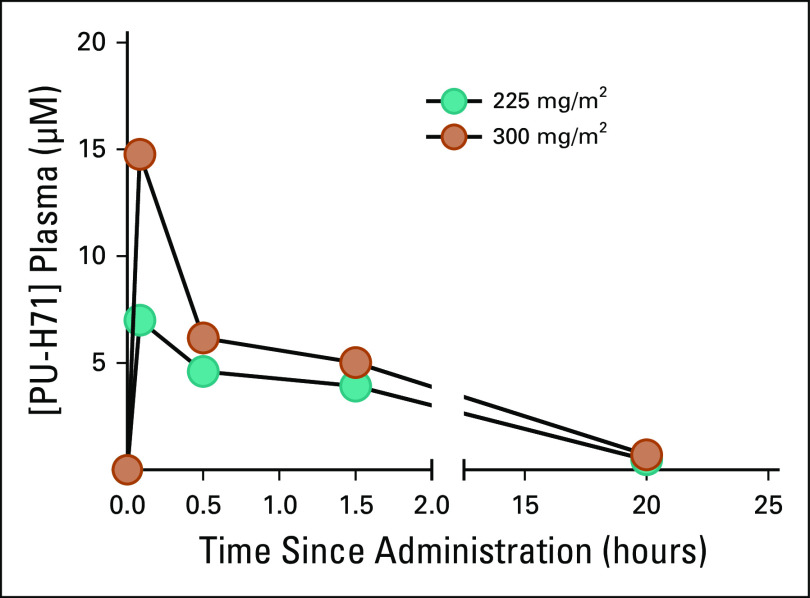
FIG 1.
Concentration of PU‐H71 (ng/mL) during the first 24 hours after infusion. Plasma pharmacokinetics of PU‐H71: Mean concentration‐time profiles after single doses of 225 or 300 mg/m2 PU‐H71 after cycles 1 and 2 combined are shown. Green circles represent PU‐H71 dose level 1 (225 mg/m2) and orange circles represents PU‐H71 dose level 2 (300 mg/m2), both administered at 6 hours after the nab‐paclitaxel infusion.

