
FIG 1.
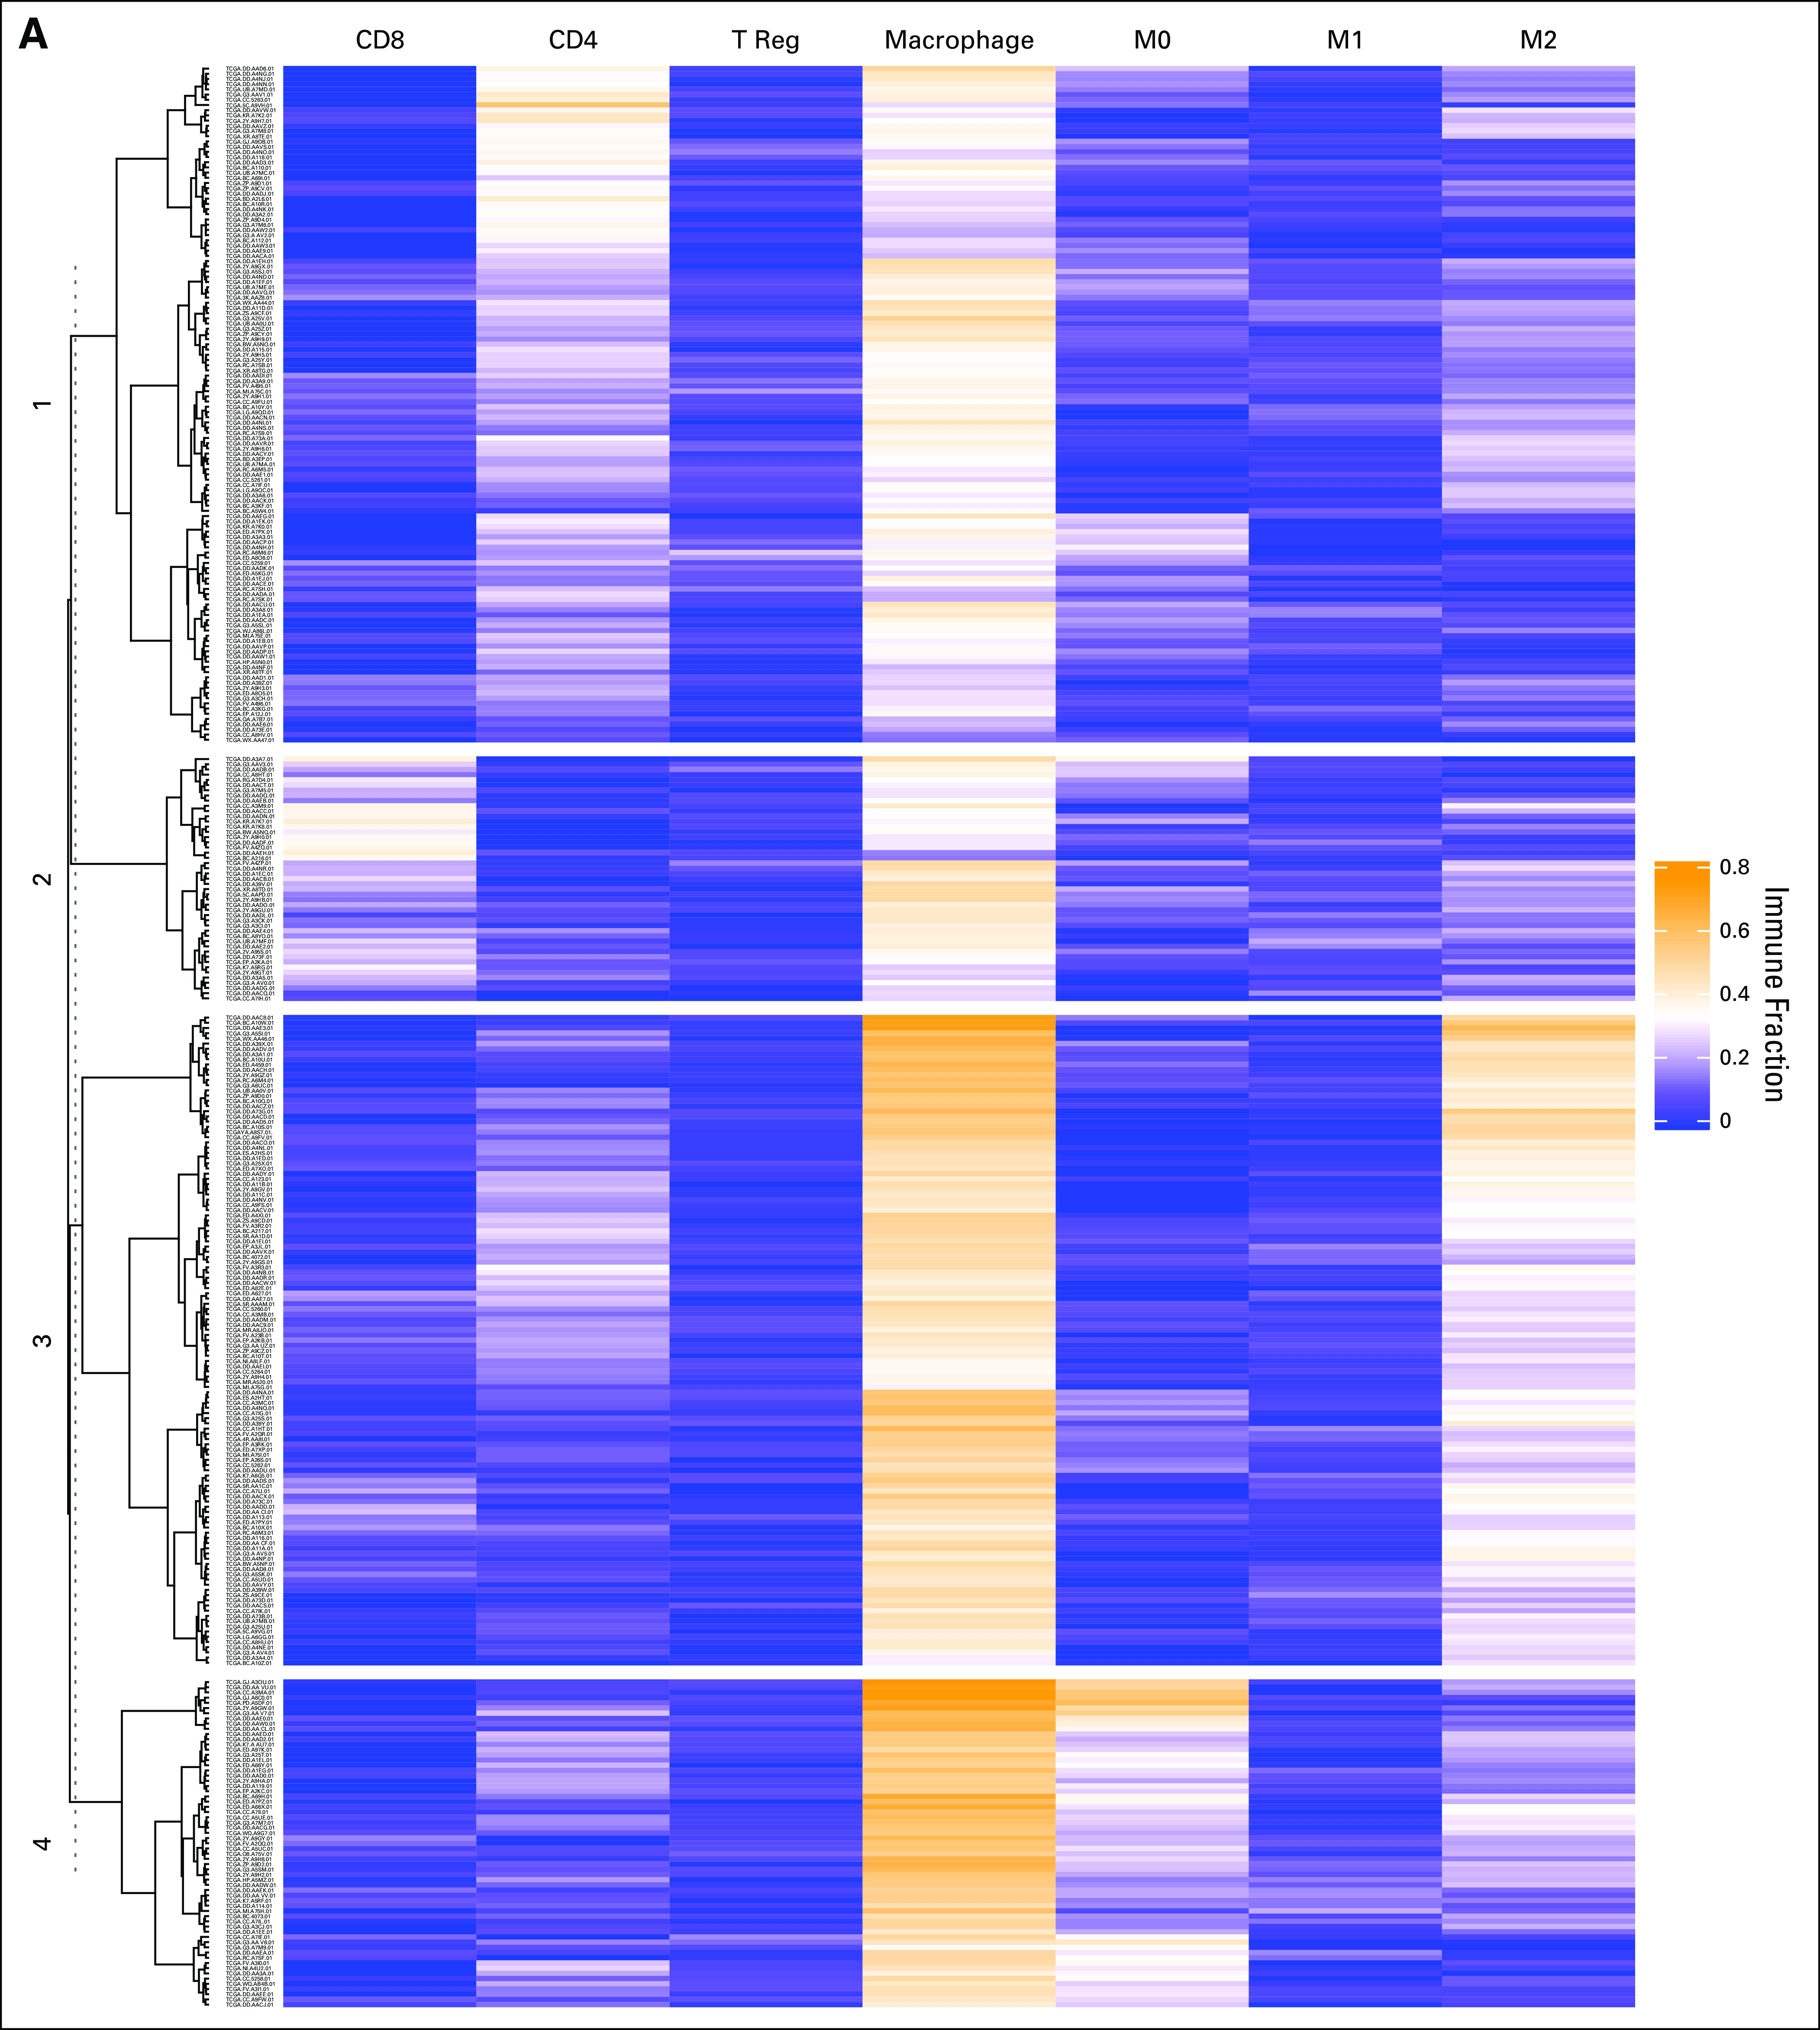
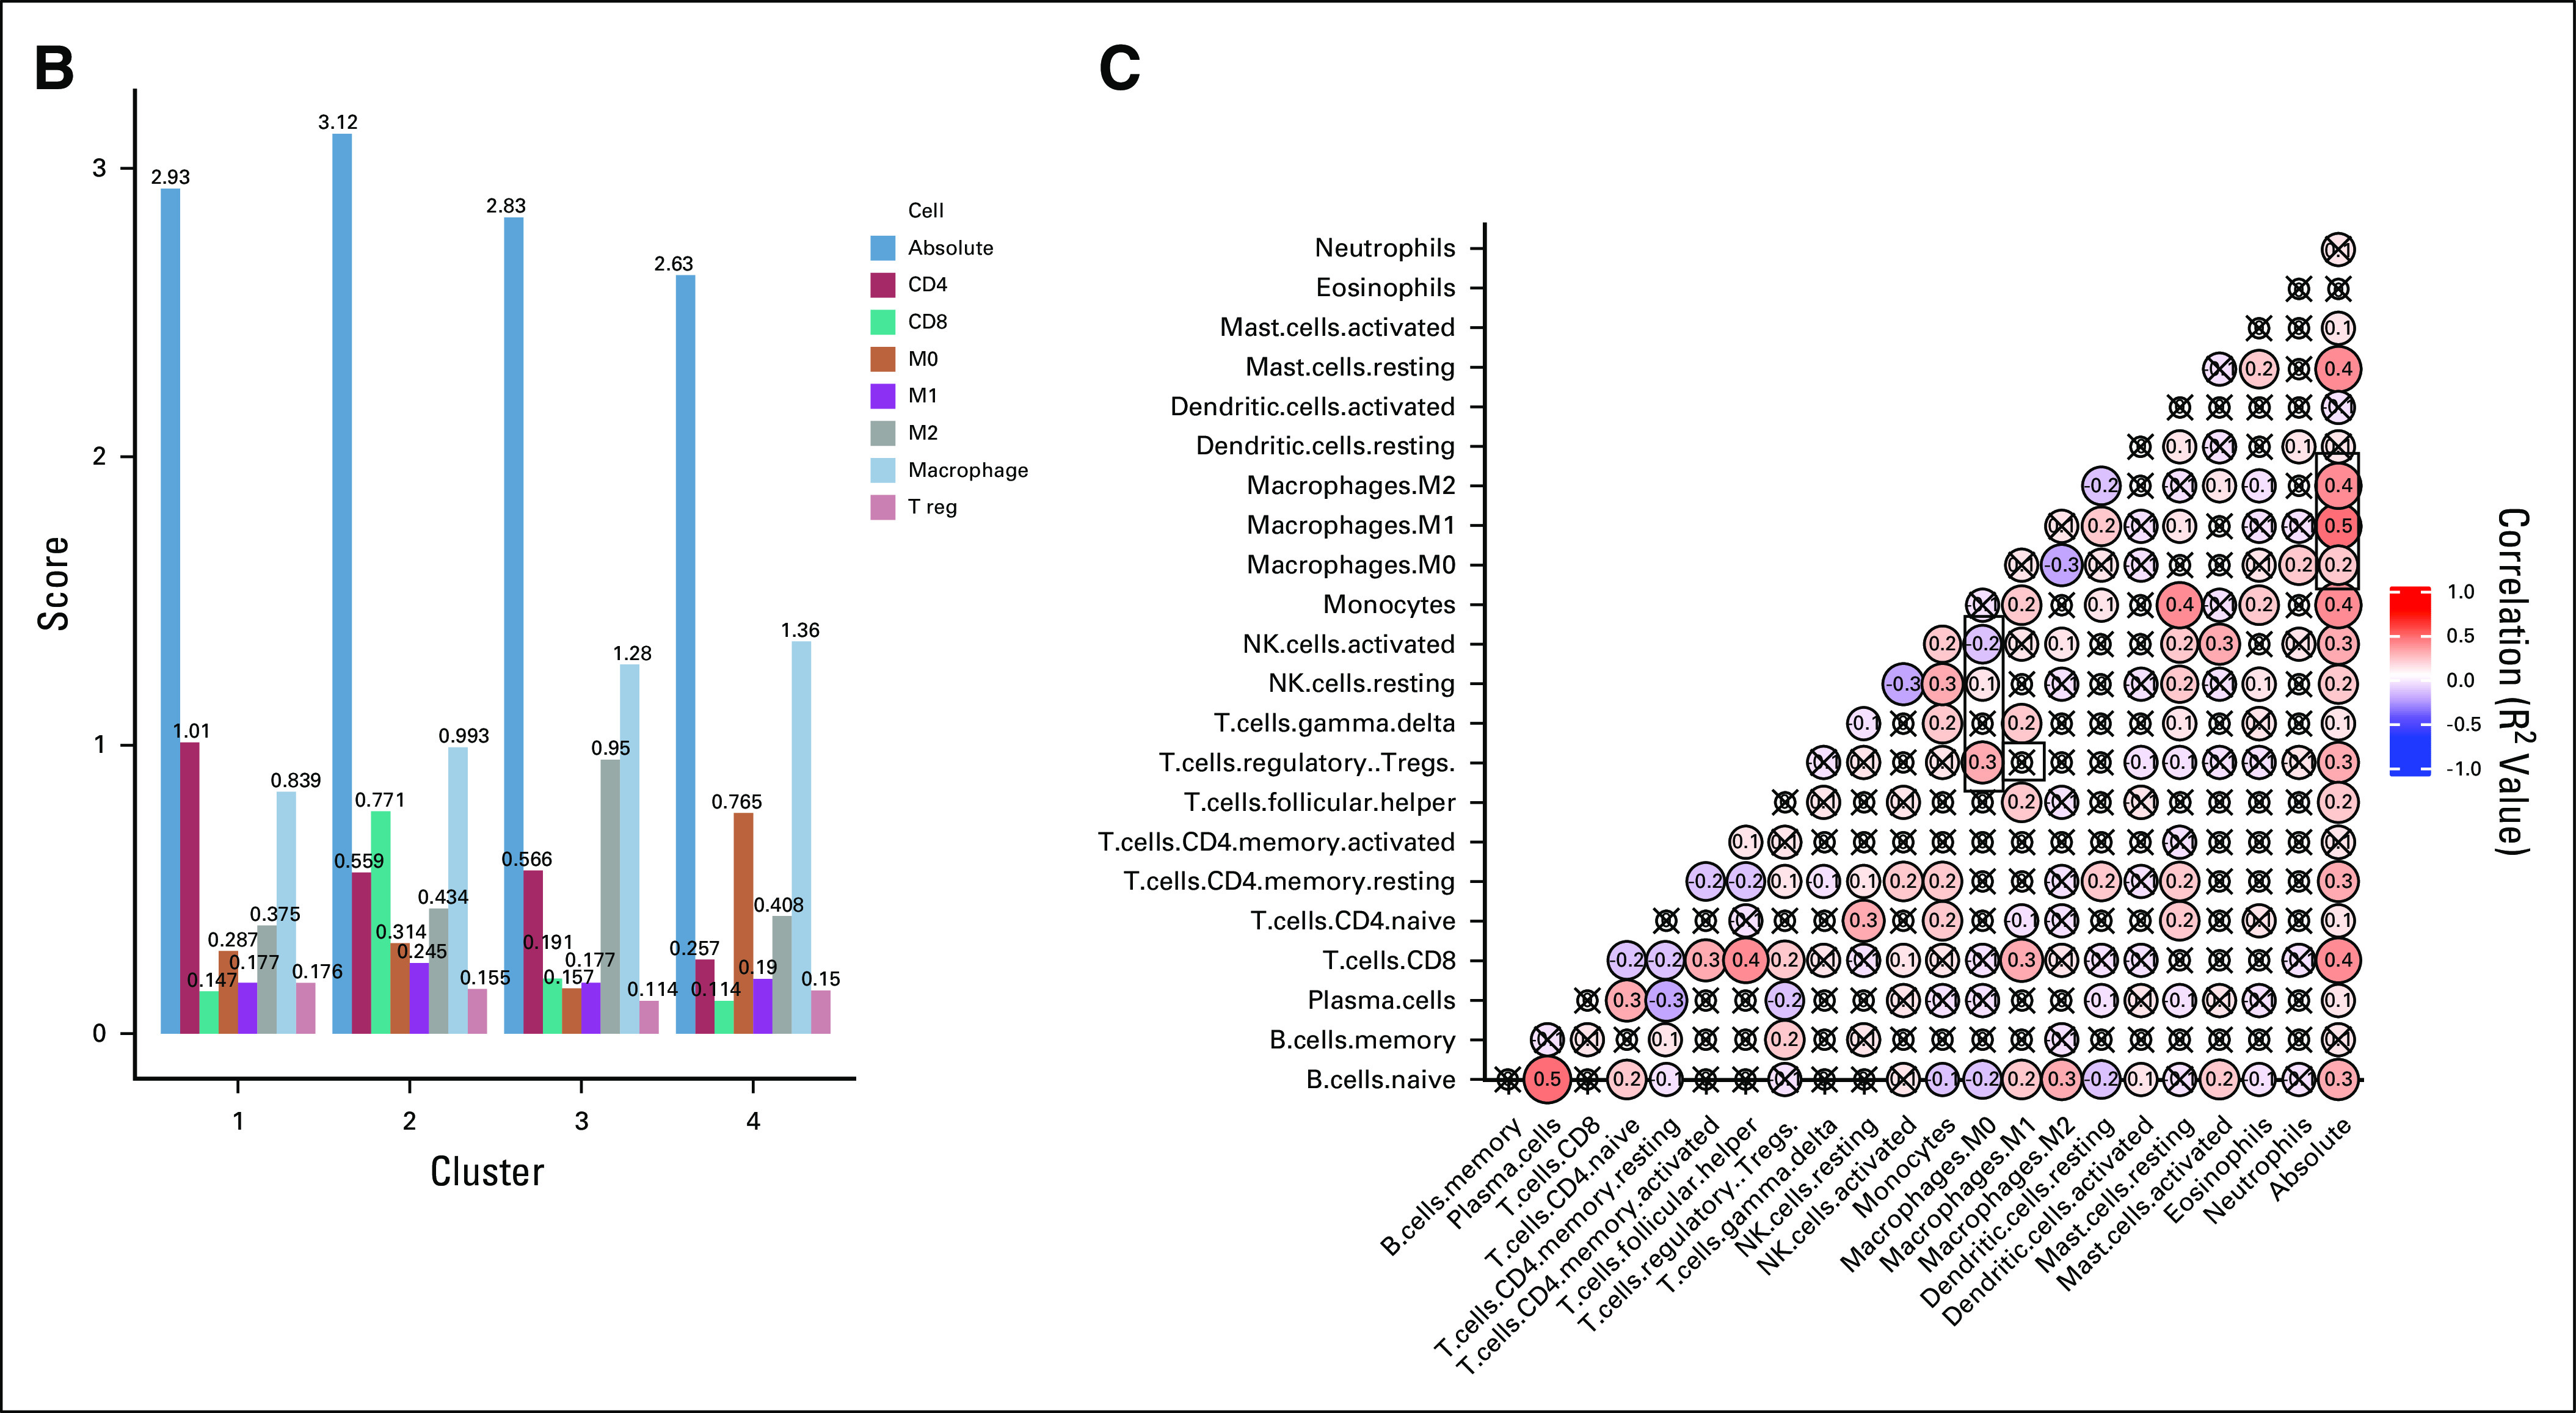
Hierarchic clustering based on immune cell subsets identifies macrophage-enriched clusters. (A) The results of unsupervised hierarchic clustering based on immune cell subsets comprising each sample in the Cancer Genome Atlas–Liver Hepatocellular Carcinoma (TCGA-LIHC) dataset. The columns correspond with immune cell subsets, and the rows represent patient sample IDs. Yellow shading represents higher relative fraction, whereas blue shading represents lower relative fraction. The clusters are defined as follows: cluster 1: macrophageMid and C4Hi; cluster 2: macrophageMid and CD8Hi; cluster 3: macrophageHi and M2Hi; and cluster 4: macrophageHi and M0Hi. (B) The mean absolute immune scores, derived from CIBERSORT, presented as a barplot grouped by clusters. Bars are colored according to the corresponding immune cell. (C) A correlation matrix of correlation coefficients for all possible immune cell subset pairings. Red shading represents positive correlation, whereas blue shading represents negative correlation. The size of each bubble and the intensity of the shading correspond to the magnitude of the correlation coefficient. Correlations that did not meet significance are marked with an x. T reg, regulatory T cells.