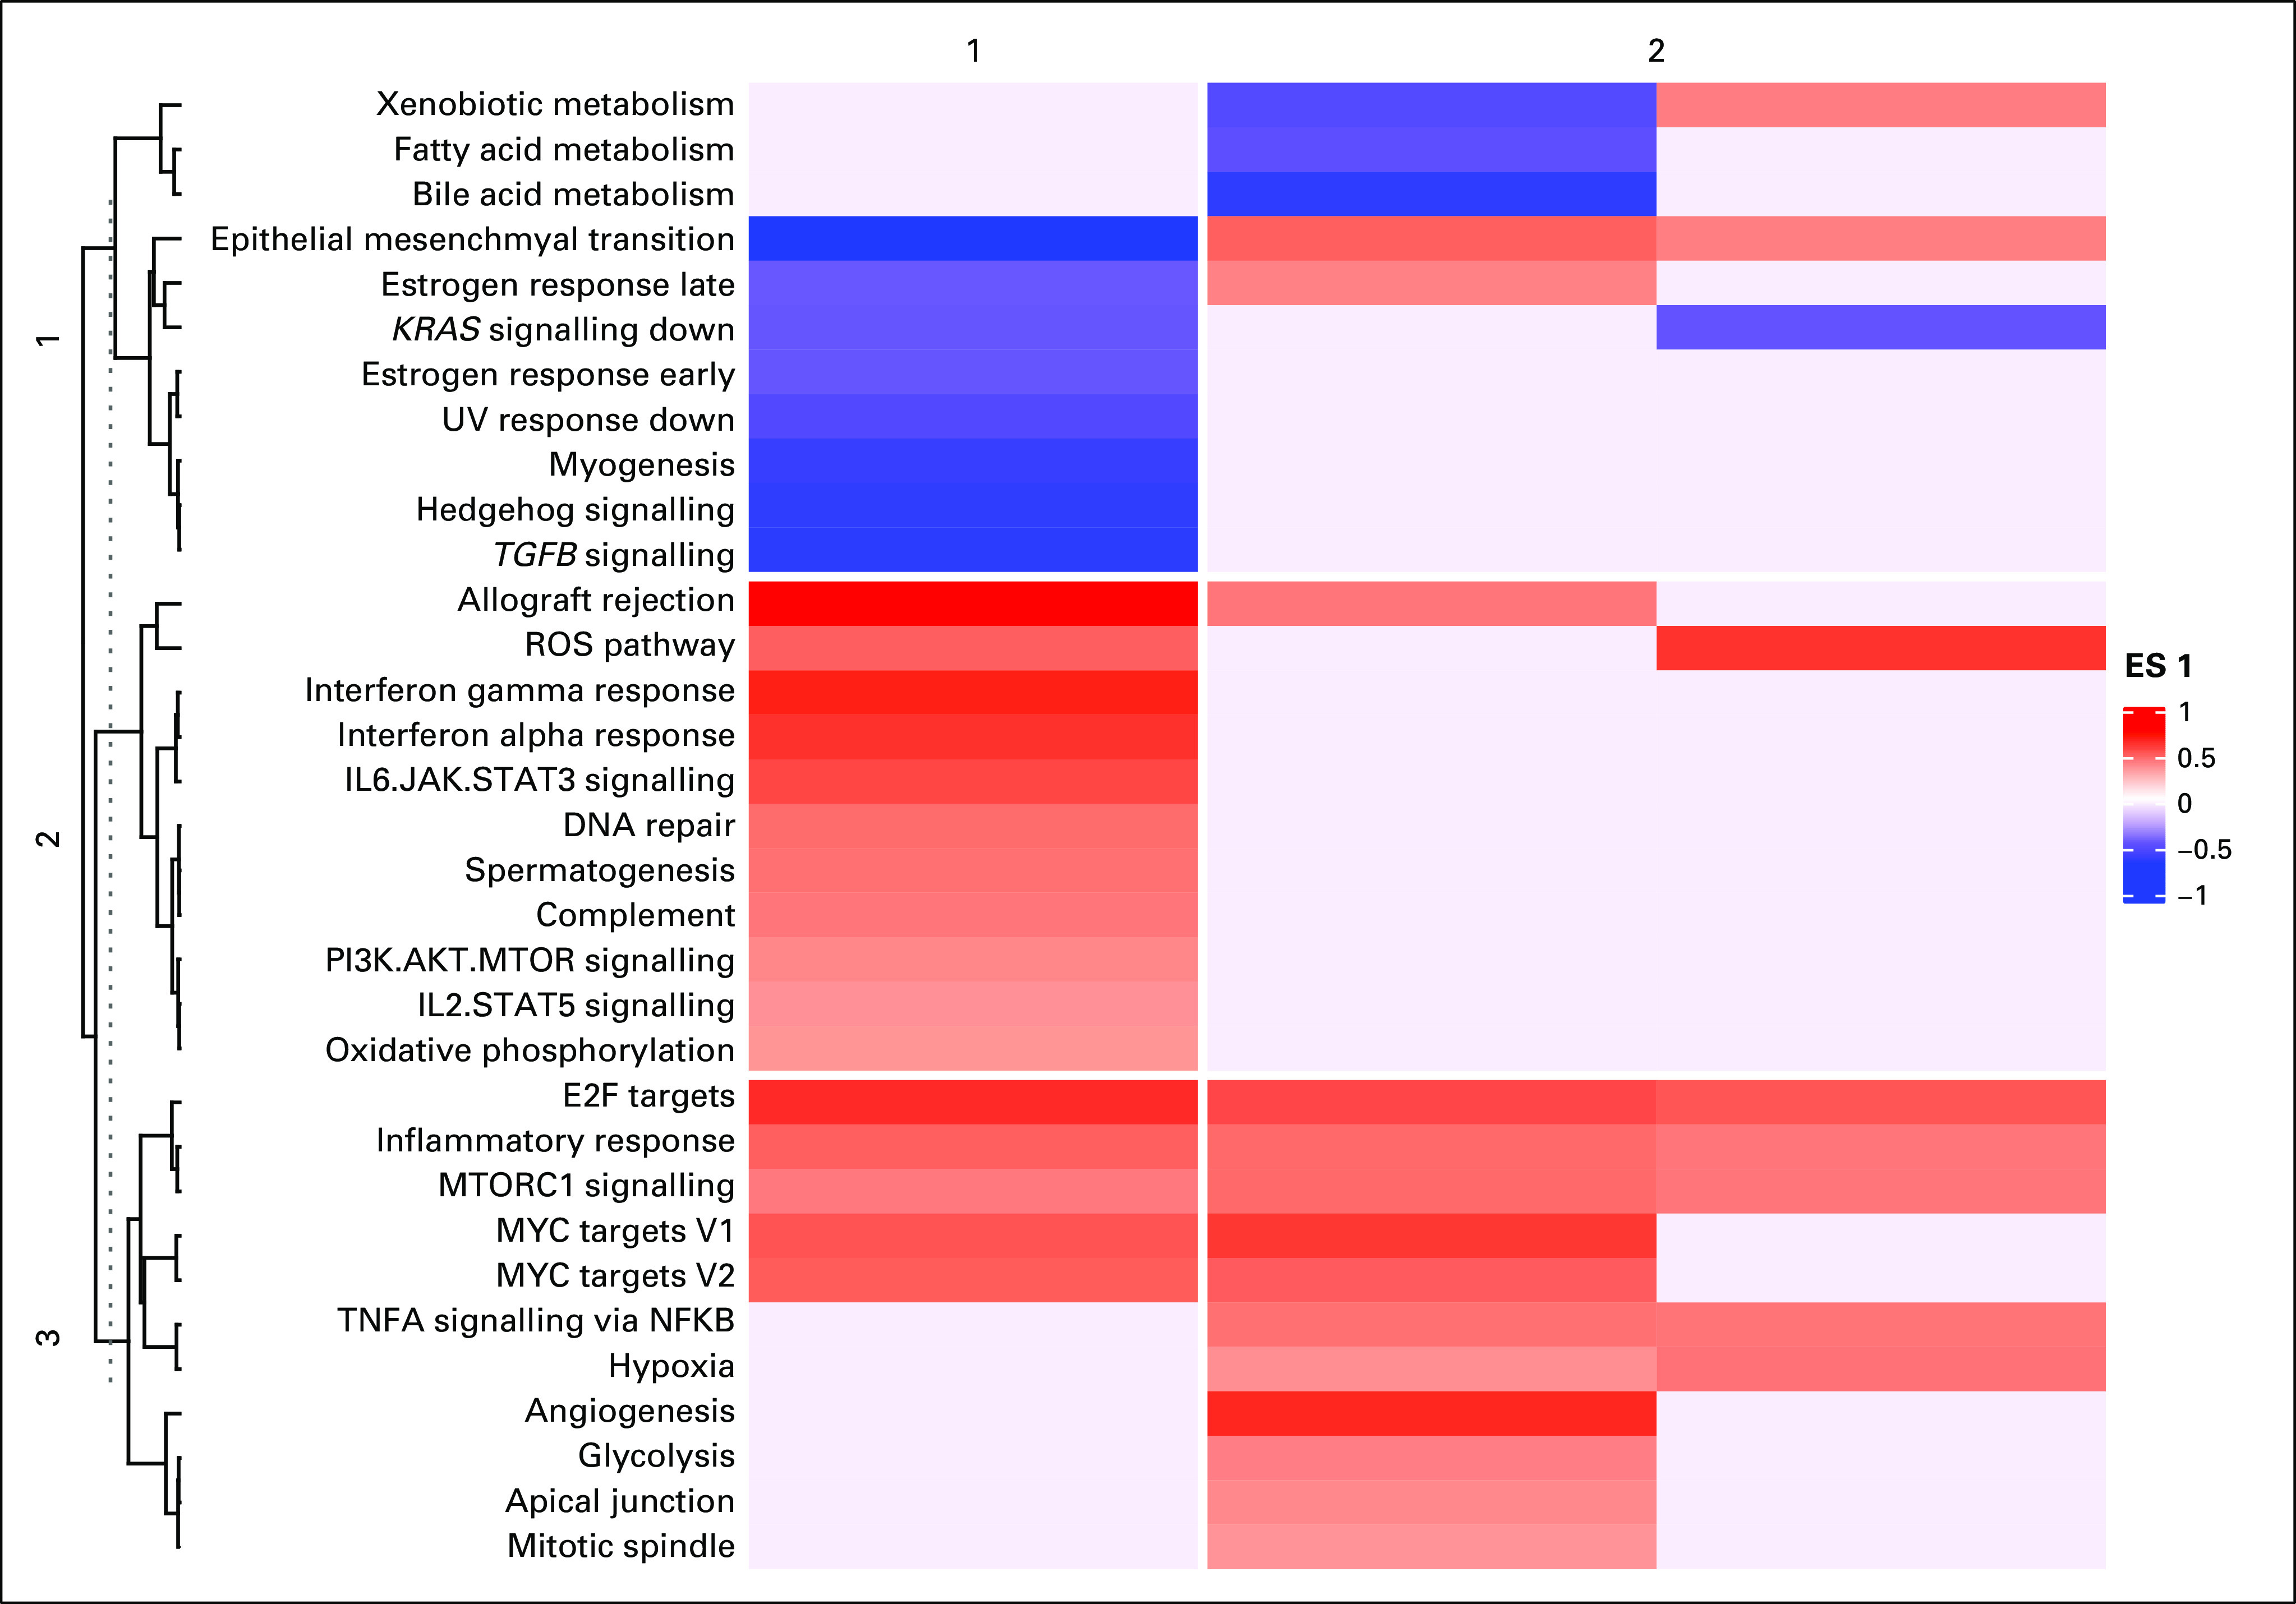
FIG 4.

Gene set enrichment analyses (GSEA) identifies enrichment of angiogenesis hallmark genes. Heatmap representing the enrichment scores of MSigDB cancer hallmarks. A red shade represents a gene set that is overenriched and a blue shade represents a gene set that is underenriched. The intensity of the shade corresponds to the magnitude of the enrichment score. Blanks in the heatmap represent gene sets that were not significantly overenriched or underenriched. Clustering was performed on both rows (hallmark gene sets, n = 3), and columns (clusters, n = 2). ES, enrichment score.
