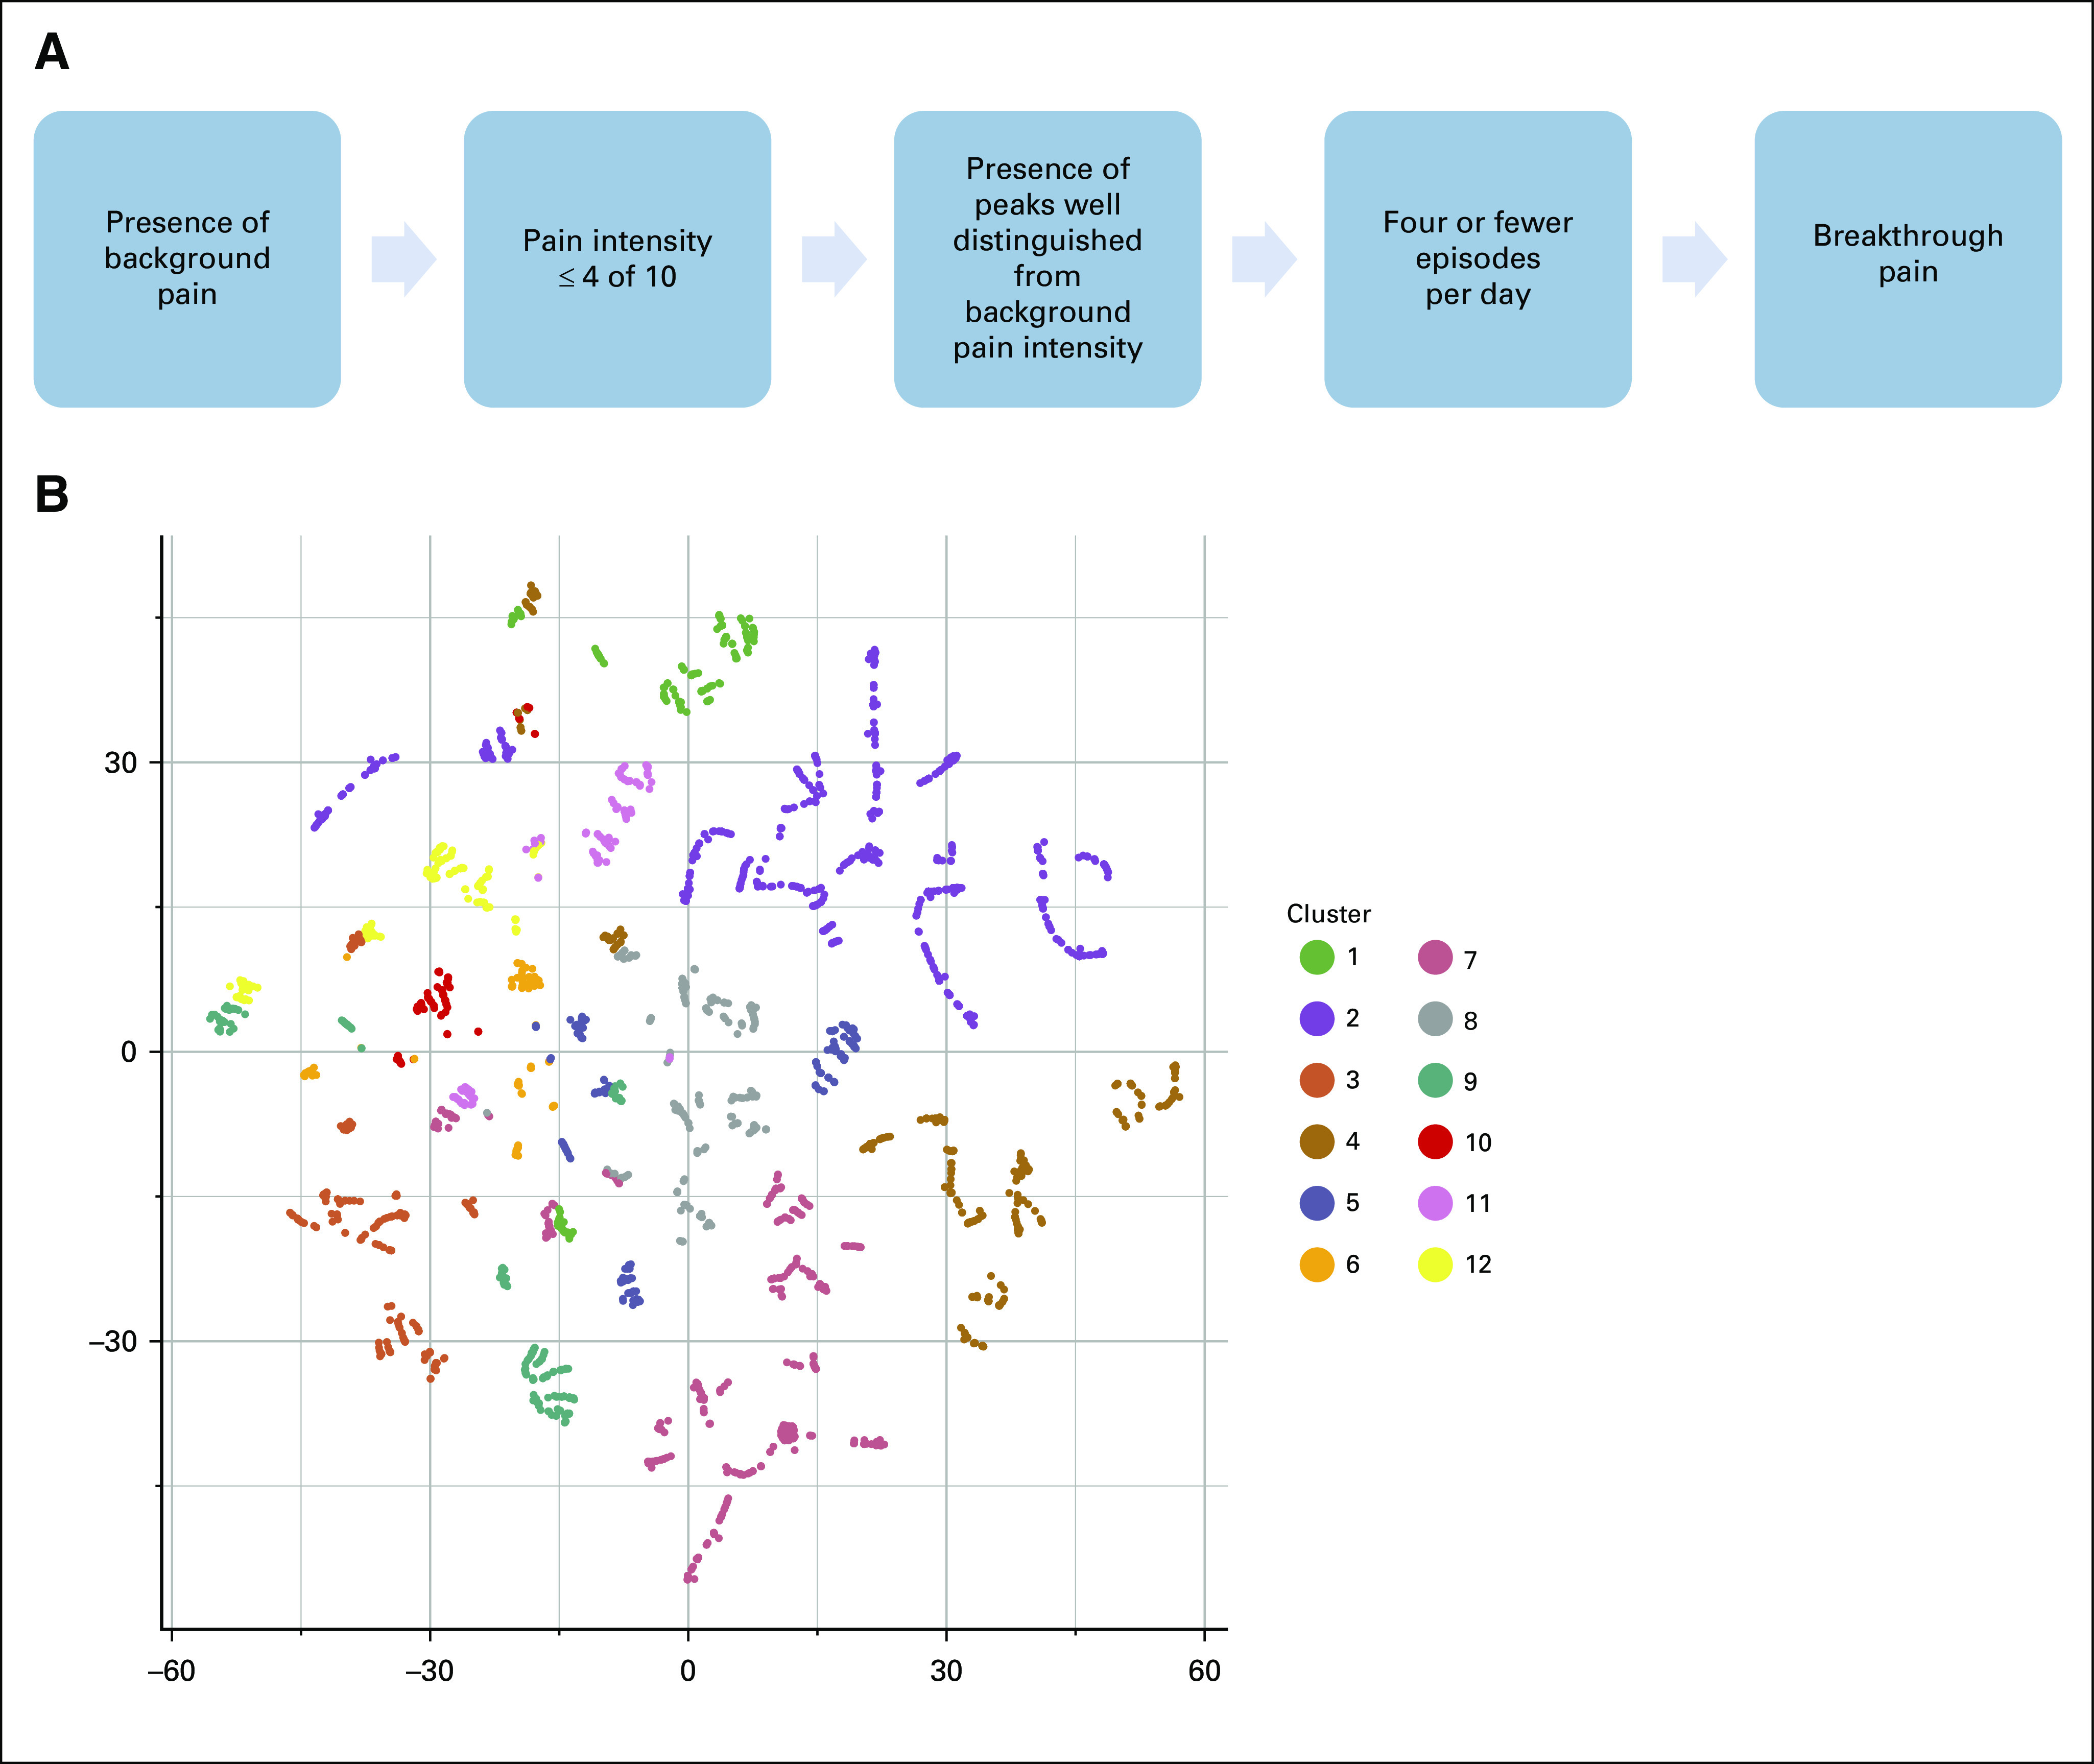
FIG 1.

(A) Algorithm used for the diagnosis of breakthrough cancer pain (BTcP) during patients’ enrollment in the Italian Oncologic Pain Survey (modified from Mercadante et al8). (B) A two-dimensional t-distributed stochastic neighbor embedding projection of all patients, colored by their clusters, on the basis of the following BTcP features: number of BTcP episodes, BTcP peaks duration, BTcP type, BTcP intensity, number of days since the beginning of BTcP episodes, eventual benefit from pharmacotherapy, eventual benefit from rest, and whether BTcP was enhanced by movements. Each point represents a patient. Patients’ dissimilarity in BTcP clinical features is represented by the points distance. Colors represent 12 clusters computed through partitioning around the medoids (k-medoids) algorithm.
