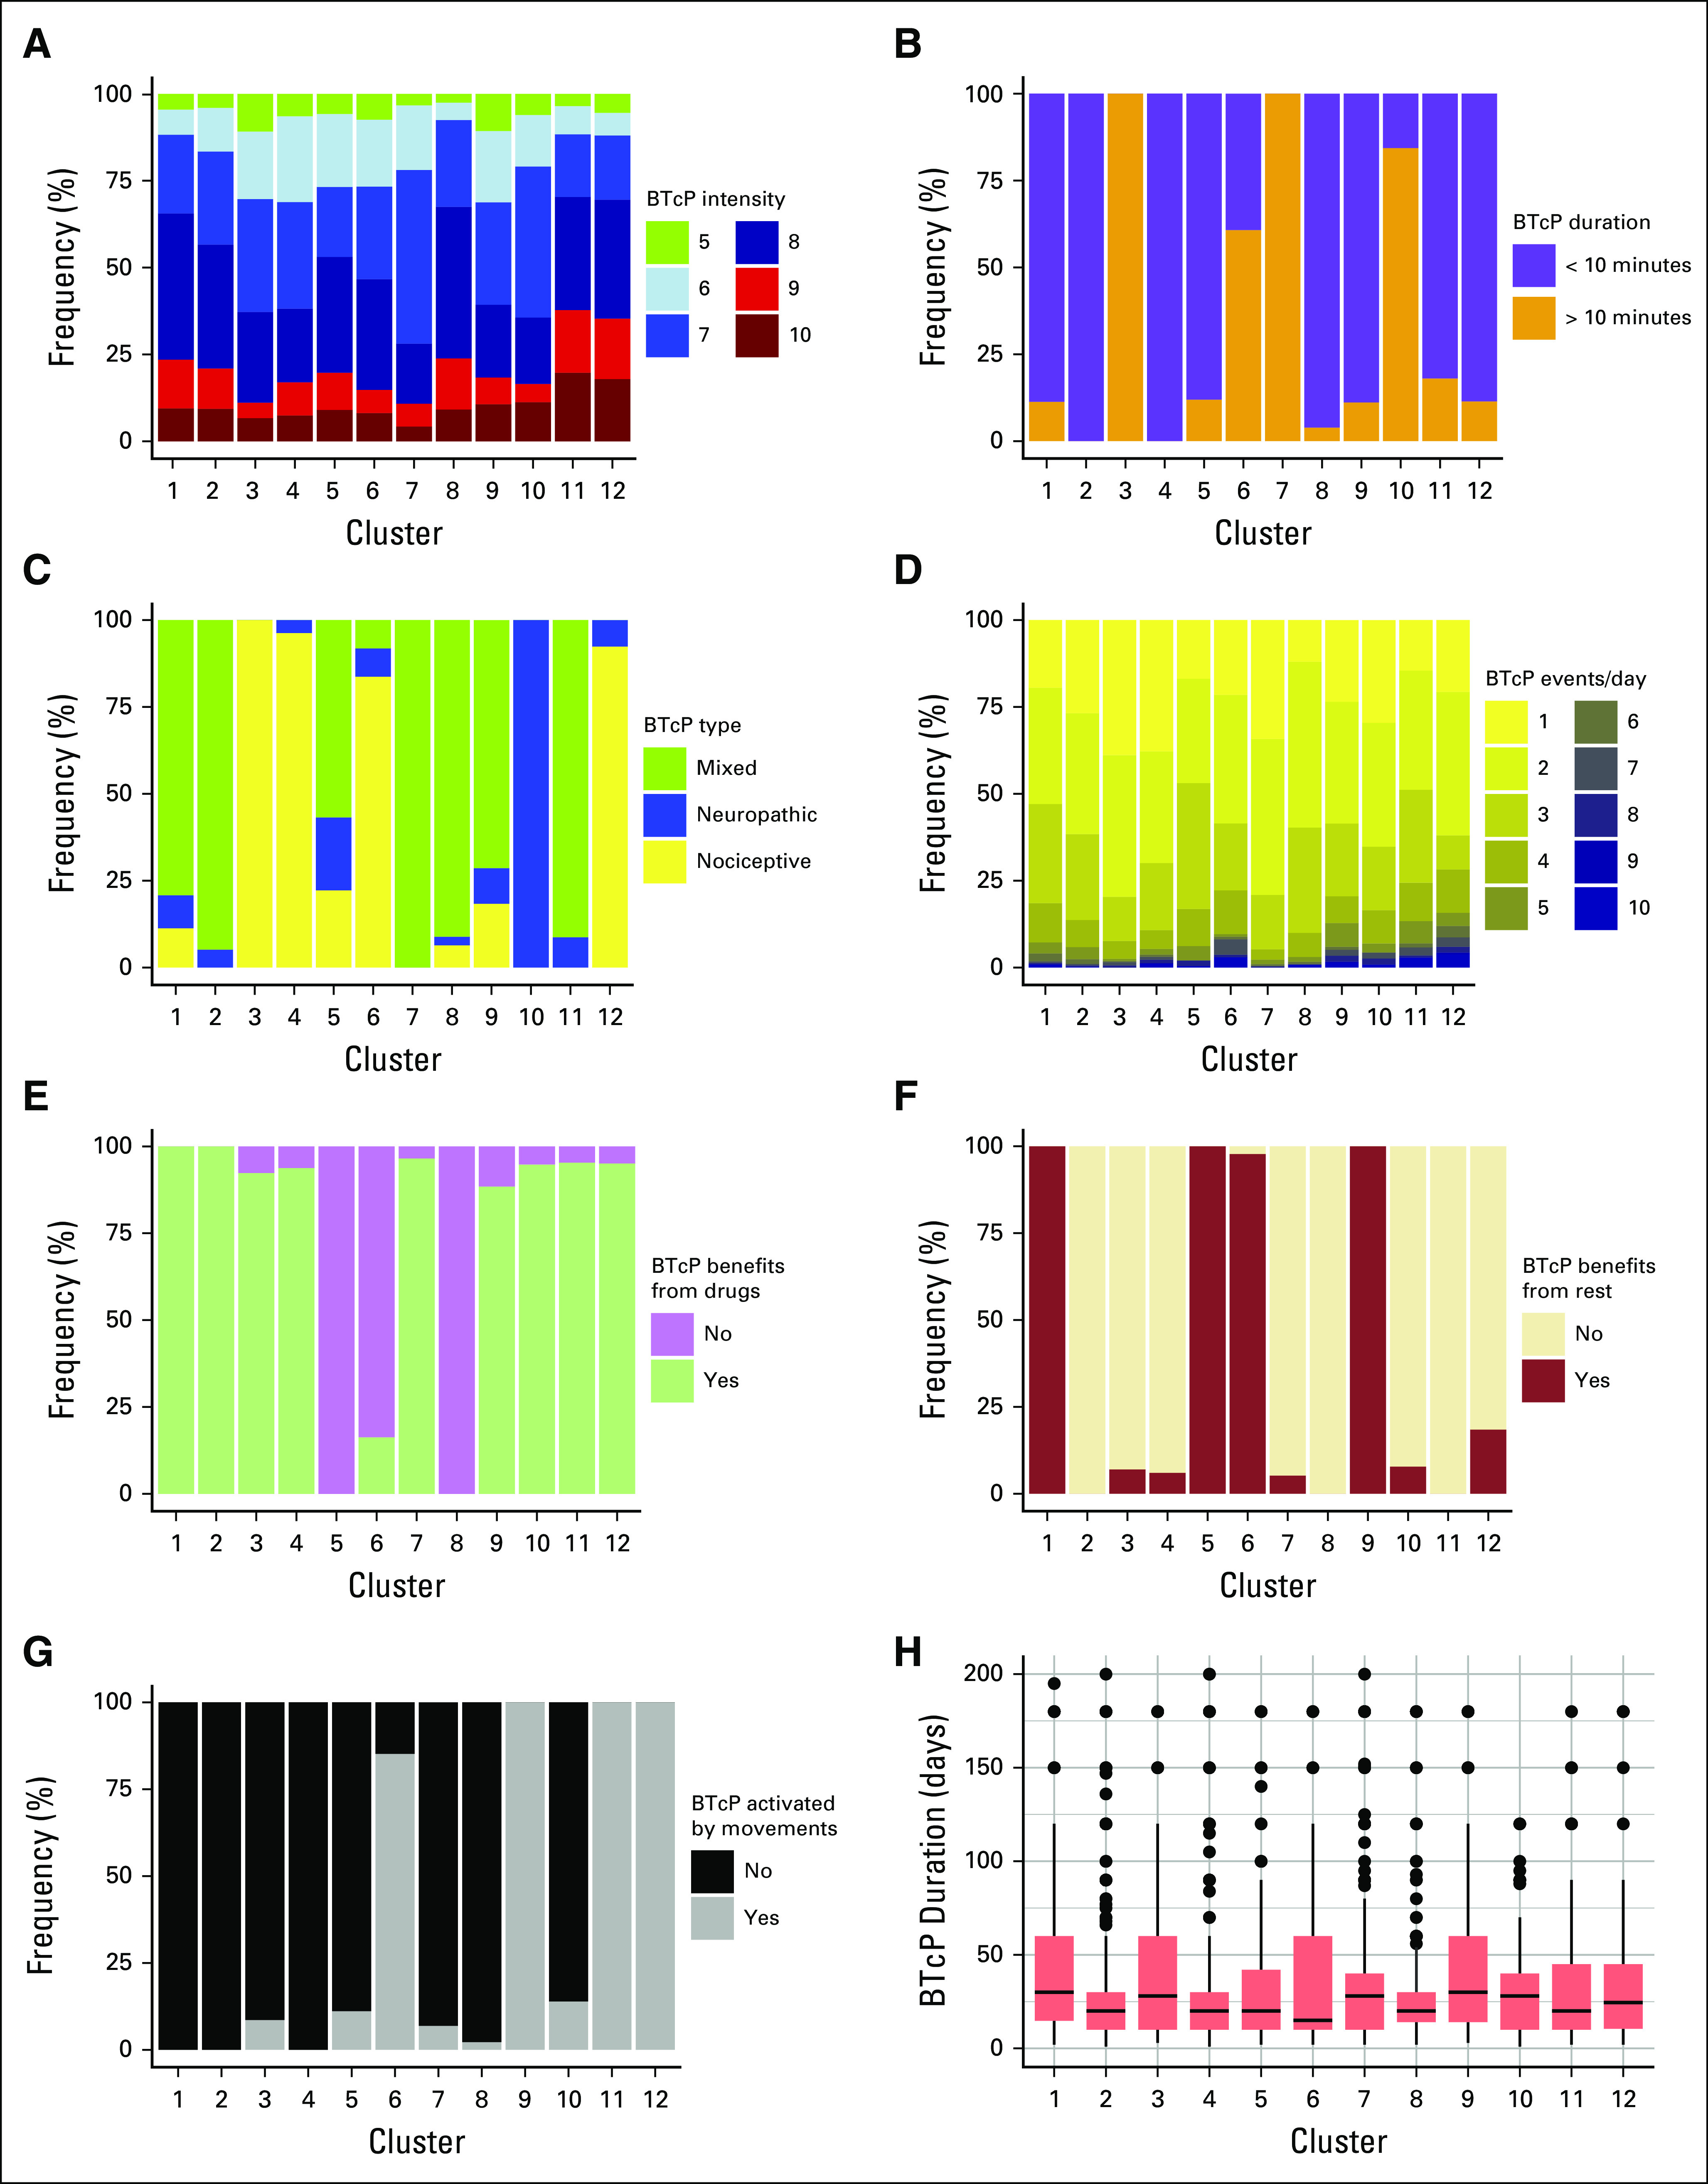
FIG 2.

Defining features of the 12 breakthrough cancer pain (BTcP) clusters. Plots represent in order: (A) BTcP intensity using numeric rating scale, (B) BTcP peak duration, (C) BTcP type, (D) number of BTcP events per day, (E) presence of benefit in BTcP management with pharmacotherapy, (F) presence of benefit in BTcP management with rest, (G) presence of BTcP activation with movements, and (H) days since BTcP episodes started.
