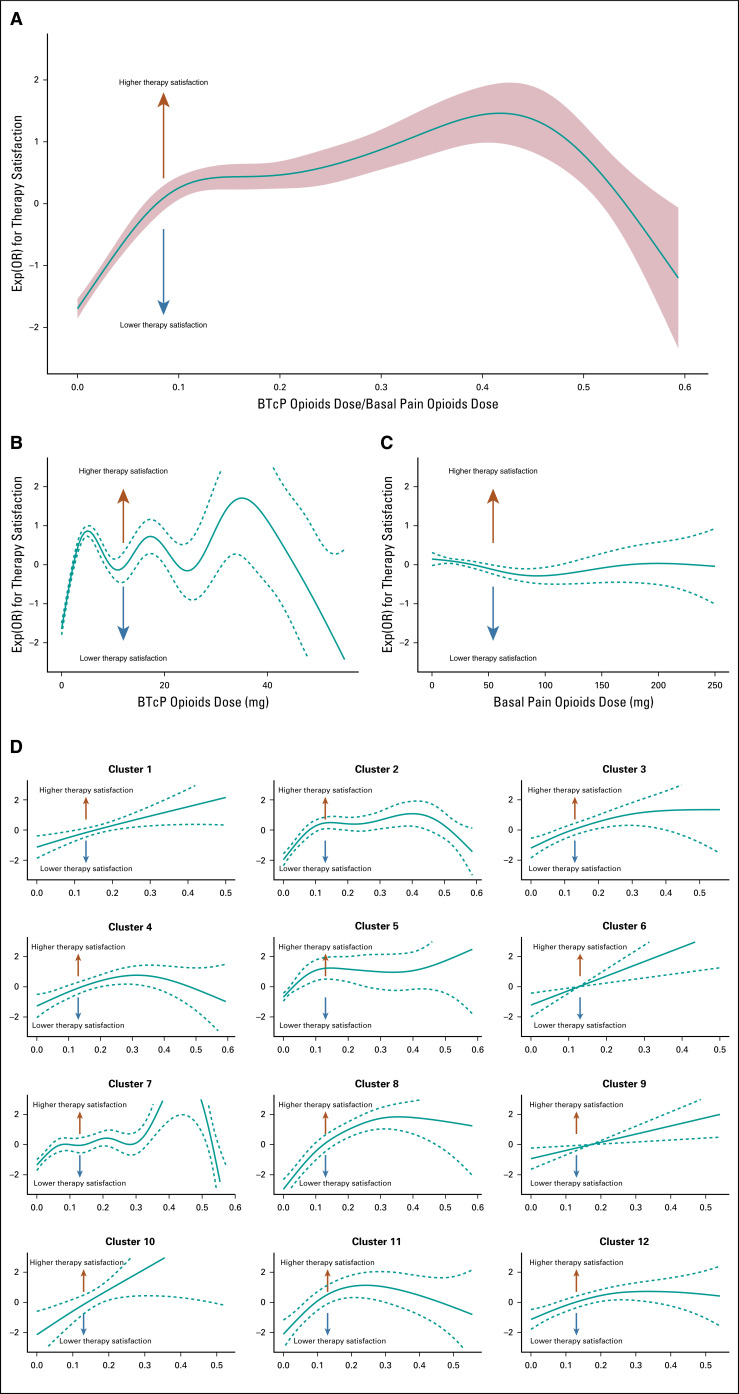
FIG 3.
(A) Correlation of breakthrough cancer pain (BTcP) therapy satisfaction with BTcP opioid dose and basal pain opioid dose ratio. (B) BTcP opioid drug dose alone, and (C) basal pain opioid drug dose. Solid lines represent logistic regressions calculated with more than 1 degree of freedom and dashed lines represent 95% CIs. (D) Correlation between fast to basal opioids ratio and therapy satisfaction for each cluster. Exp(OR), exponent (odds ratio).

