
Figure 4.
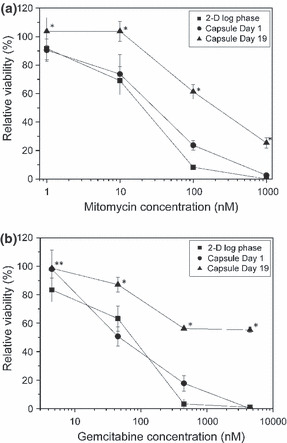
Dose–response curves of mitomycin (a) and gemcitabine (b) for HeLa cells cultured on a 2‐D culture dish (■) at log phase, and in microcapsules at day 1 (•) and 19 (▲). Bar = SD (n = 3). *P < 0.01 vs 2‐D and Capsule Day 1; **P < 0.01 vs 2‐D, analyzed by one‐way anova with Tukey’s post‐hoc analysis.