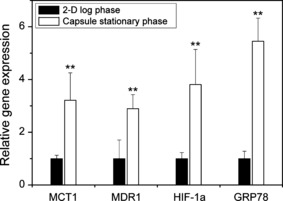
Figure 5.

mRNA expression in HeLa cells cultured on a culture dish at log phase (2‐D) and in microcapsules at stationary phase on Day 18–21 (Capsule). Each value was normalized by the means of data in the 2‐D culture. Bar = SD (n = 4). **P < 0.04 vs 2‐D cultured cells analyzed by Student’s t‐test.
