
Figure 6.
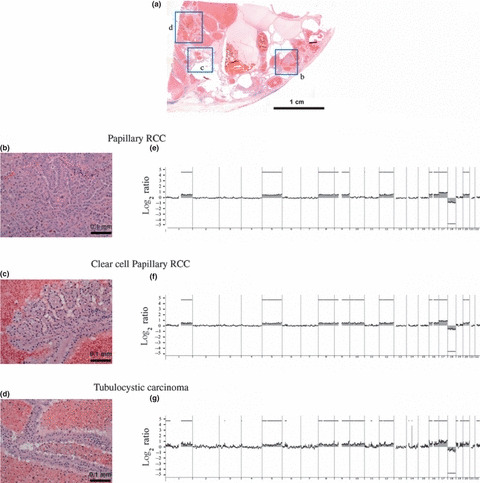
The pattern of copy number alterations (CNAs) in a case of renal cell carcinoma (RCC) in end‐stage renal disease (ESRD) containing several histologic components. (a) Histology (low‐power loupe view) of a case of RCC‐ESRD composed of papillary RCC‐ESRD (b), clear cell papillary RCC‐ESRD (c) and tubulocystic carcinoma (d). (b–d) Histology (high‐power view) of each component shown in (a). (e–g) Array comparative genomic hybridization (CGH) profiles of each histologic component. Whole‐genomic profiles of papillary RCC‐ESRD (e), clear cell papillary RCC‐ESRD (f) and tubulocystic carcinoma (g). Oligonucleotide probes are shown in order from chromosome 1 to 22 within each chromosome. The log2 ratio was plotted for all oligonucleotide probes based on their chromosome positions. The shaded areas and bold horizontal lines indicate regions of CNAs based on an ADM‐2 algorithm.