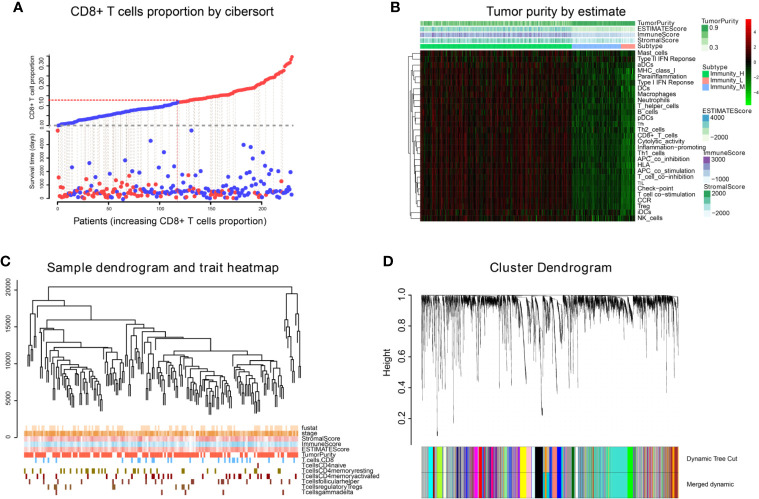
Figure 2.
WGCNA analysis. (A) The infiltration proportion of CD8+ T cells in TCGA. (B) The immune score, estimate score, stromal score, and tumor purity of TCGA-BLCA are shown, and were inputted as phenotype information for WGCNA analysis. (C) We clustered the samples by cut Height = 20,000, and 226 samples were included. The sample dendrogram of 226 samples and trait map are shown. (D) Hierarchical clustering tree was built using the dynamic hybrid cutting method, where each leaf on the tree represents a gene, and each branch represents a co-expression module; 28 co-expression models were generated.

