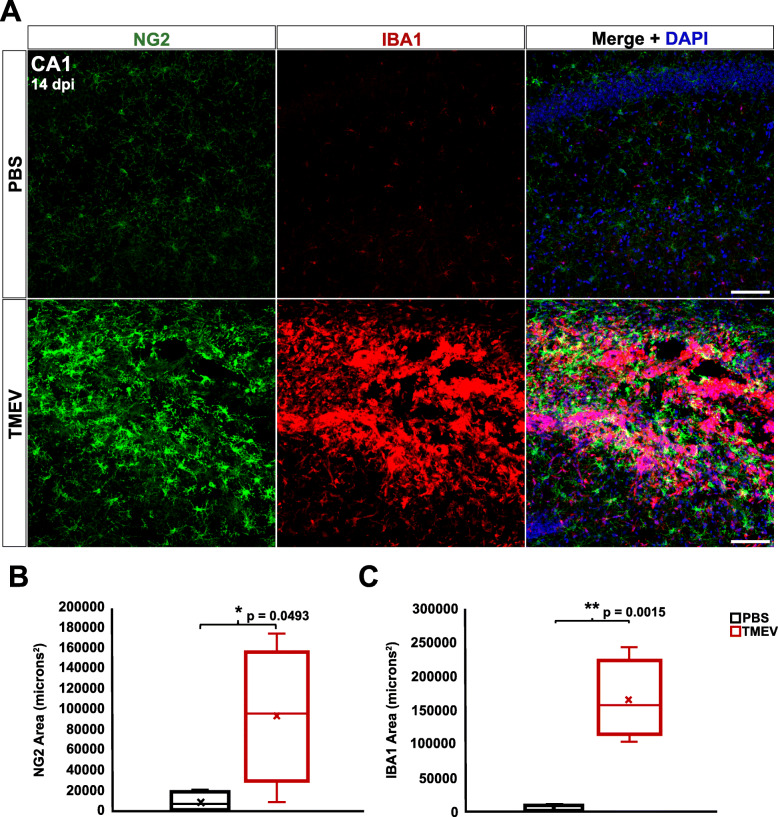
Fig. 4.
TMEV-injected animals exhibit scarring and reactive NG2 cells and microglia/macrophages in the hippocampus at 14 dpi. a NG2 cells (green) and microglia/macrophages (red) in the CA1 region of the hippocampus of PBS-injected (top) and TMEV-injected (bottom) mice at 14 dpi. b TMEV-injected mice showed significantly greater immunoreactivity for NG2 compared to PBS-injected mice. c TMEV-injected mice showed significantly greater immunoreactivity for IBA1 compared to PBS-injected mice. Images are ×20 maximum-intensity projections of 12 μm confocal z stacks. Scale bars = 100 μm

