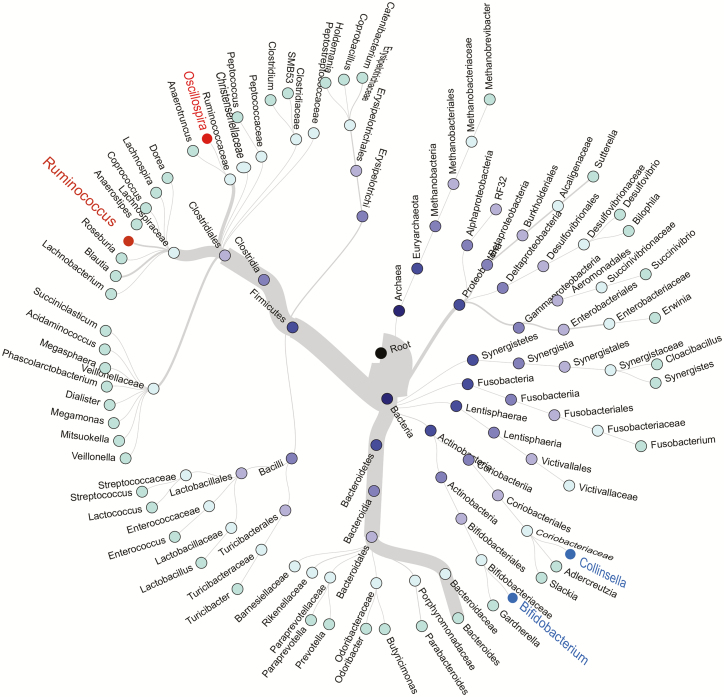
Figure 1.
Hierarchical structure tree of microbial communities. Taxa from the inner to outer circle represent the super kingdom to genus level. The branch widths reflect the relative abundance of each detected taxon. Red and blue labels depict bacterial genera with higher (red) or lower (blue) relative abundance in individuals with HIV compared with those without HIV, respectively. Genera whose average relative abundance if >0.01% are included. Abbreviation: HIV, human immunodeficiency virus.

