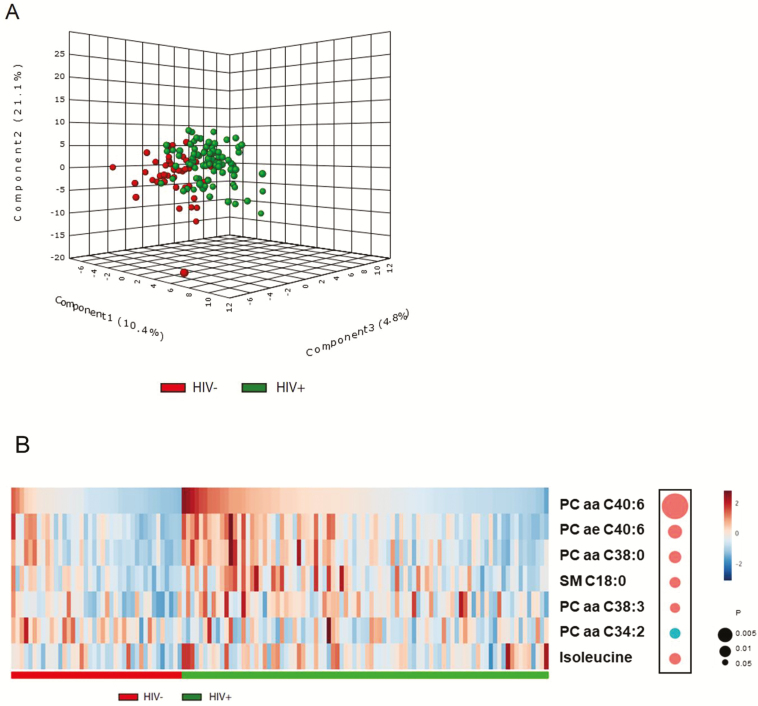
Figure 3.
Plasma metabolomic profiles and HIV infection. A, Three-dimensional PLSDA score plot by HIV status, based on 133 plasma metabolites. B, Heatmap of the top metabolites altered in individuals with HIV: 5 glycerophospholipids (phosphatidyl-choline diacyl PC aa C40:6, PC aa C38:0, PC aa C38:3, PC aa C34:2; phosphatidyl-choline acyl-alkyl PC ae C40:6), 1 sphingolipid (SM C18:0), and 1 amino acid (isoleucine). The concentration was inverse normal transformed. These metabolites were selected first by PLSDA (VIP scores ≥1.5) and then by linear regression model, adjusted for age, race, income, education, and BMI (FDR P < .05). The diameters of the bubbles represent the P values in the linear regression model. Red and blue bubbles depict metabolites that showed increased (red) and decreased (blue) concentration in individuals with HIV, respectively. Abbreviations: BMI, body mass index; FDR, false-discovery rate; HIV, human immunodeficiency virus; PLSDA, partial least-squares discriminant analysis; VIP, variable importance in projection; –, negative; +, positive.

