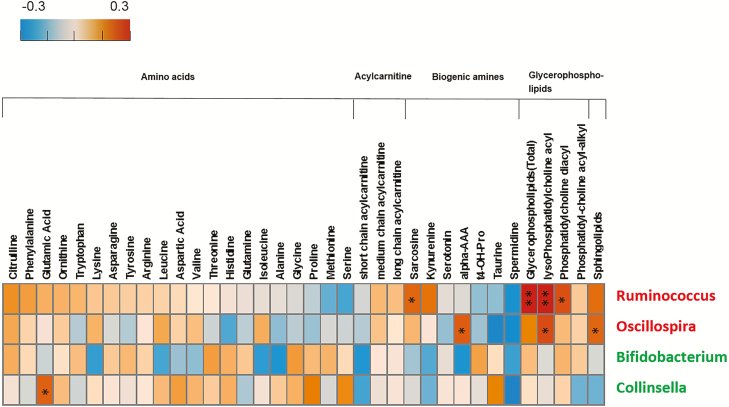
Figure 4.
Correlations between plasma metabolites and 4 HIV-associated bacterial genera. The positive Spearman rank correlation coefficients are denoted by orange squares and negative correlation coefficients by blue squares. Red and green labels depict bacterial genera that showed increased (red) and decreased (green) relative abundance in individuals with HIV. The glycerophospholipid column represents total plasma glycerophospholipid concentration (sum of all glycerophospholipid species); the lysoPhosphatidyl-choline acyl, phosphatidyl-choline diacyl, and phosphatidyl-choline acyl-alkyl columns represent the total concentration for each glycerophospholipid subcategory, respectively. *P < .05; **P < .01. Abbreviation: HIV, human immunodeficiency virus.

