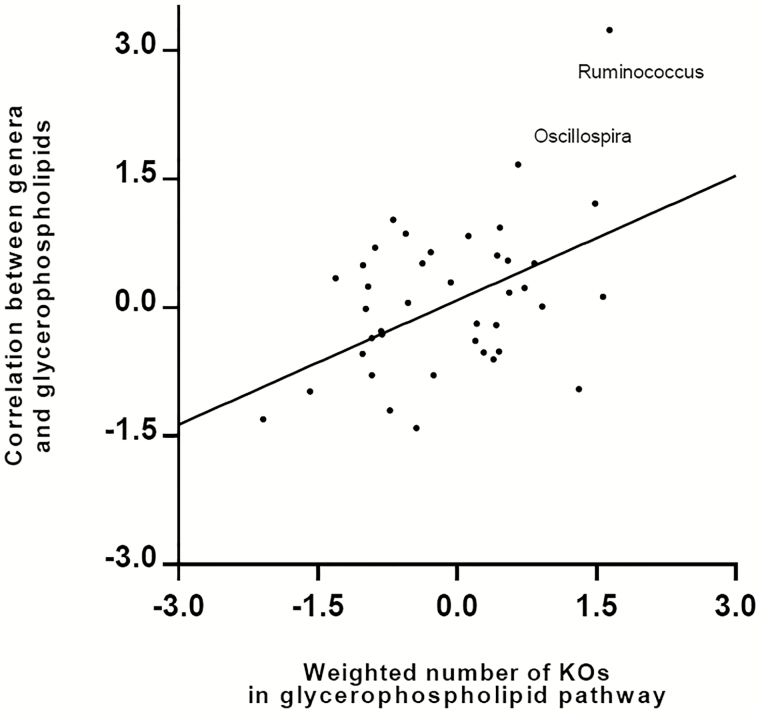
Figure 5.
Relationships among predominant bacterial genera, host plasma glycerophospholipids, and bacteria’s contribution to the glycerophospholipids metabolism pathway. Each node represents 1 genus, and all the predominant genera with average relative abundance >0.05% were included in this analysis. The x axis describes the weighted bacteria’s enzyme contribution to the glycerophospholipid metabolism pathway (inverse normal transformed). The y axis depicts the Spearman correlation coefficients (inverse normal transformed) between the relative abundance of bacterial genera and plasma glycerophospholipid metabolite concentration. Each genus’s contribution to the glycerophospholipid metabolism pathway was first measured by the number of KOs, which were genetically encoded by the bacteria, according to PICRUSt-imputed functional content analysis. Then this genetic contribution was weighted by the relative abundance of each genus. Abbreviation: KO, KEGG ortholog group; PICRUSt, Phylogenetic Investigation of Communities by Reconstruction of Unobserved States.

