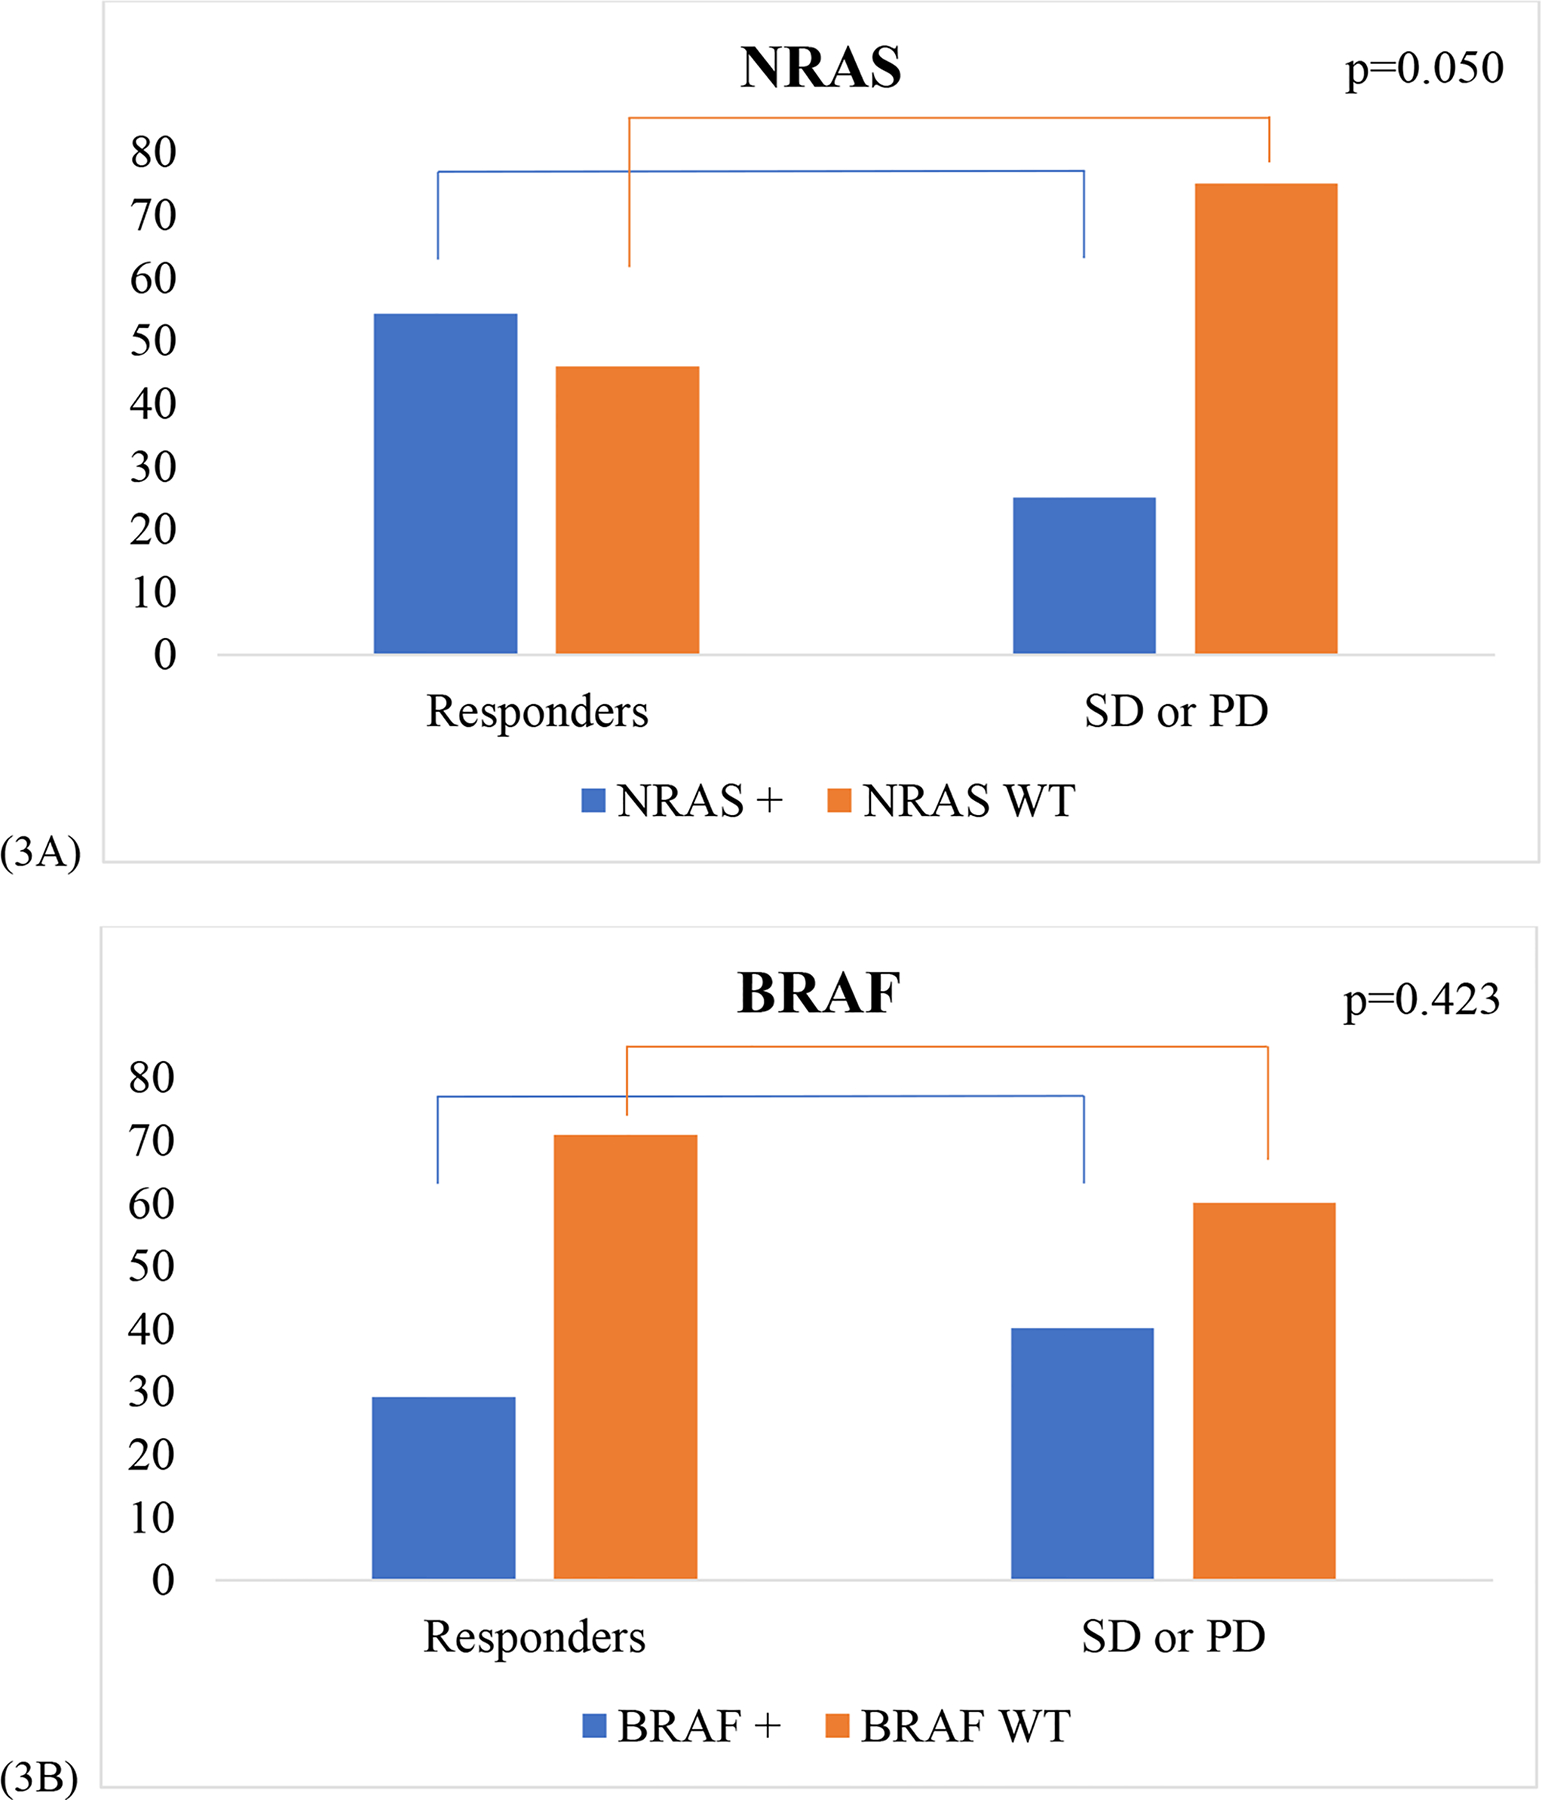
Figure 3: Gene Mutation Profiles.

(3A): Proportion of NRAS positive (+) and NRAS WT in responders to immunotherapy compared to patients with SD or PD. A greater proportion of responders to immunotherapy were NRAS positive compared to patients with SD or PD (p=0.050). (3B): Proportion of BRAF positive (+) and BRAF WT in responders to immunotherapy compared to BRAF + and BRAF WT patients with SD or PD (p=0.423).
