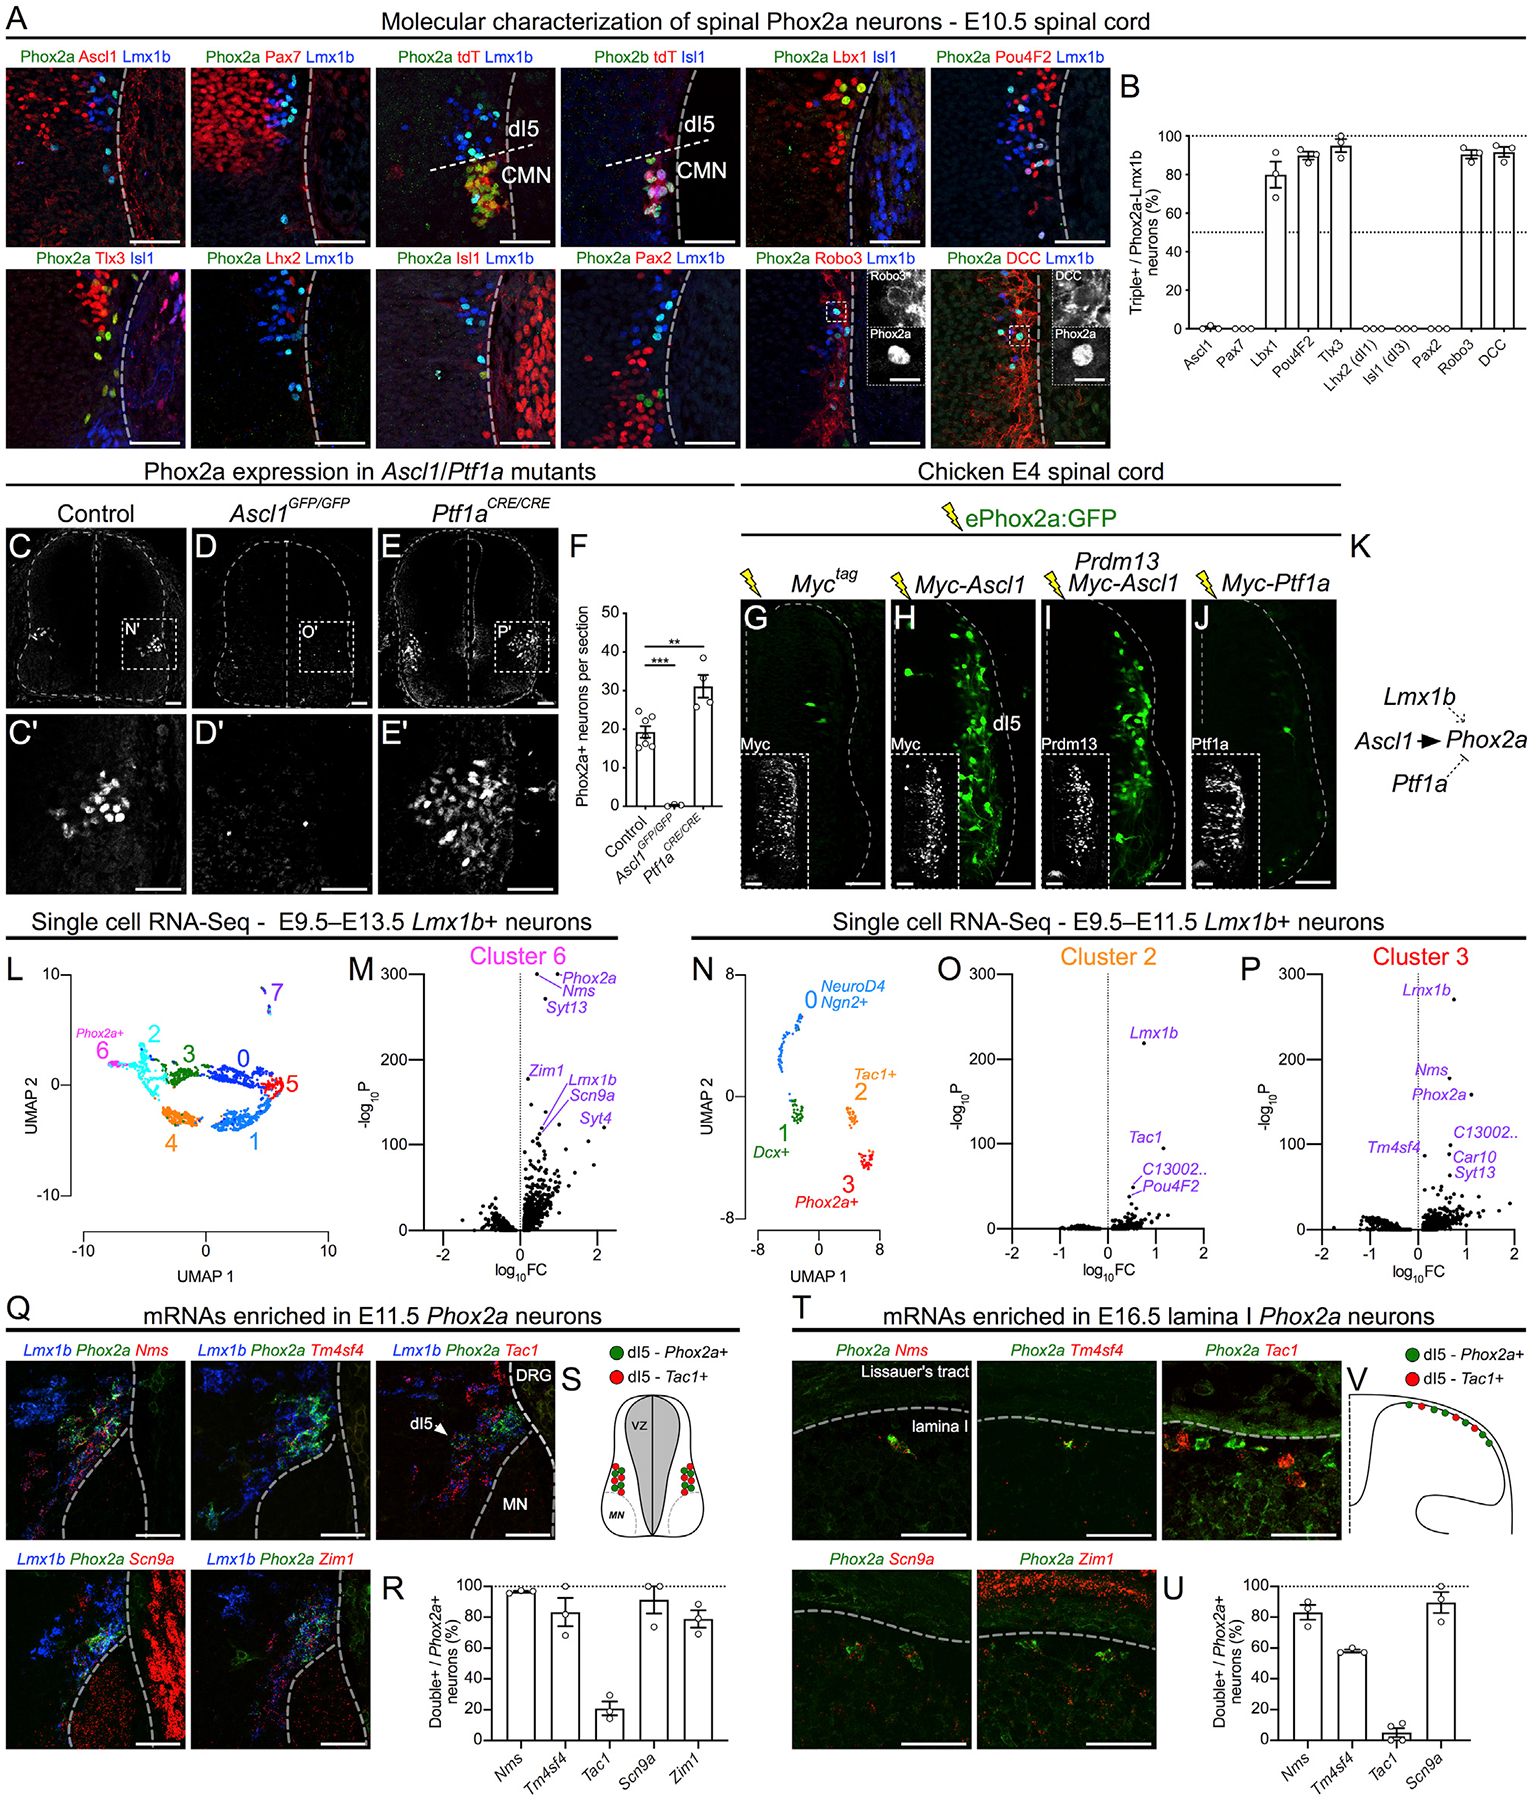
Figure 5. The Molecular Identity and Specification of Spinal Phox2a Neurons.

(A) Co-expression of Phox2a with embryonic spinal neuron markers in the E10.5 Phox2aCre; R26LSL-tdT/+ spinal cord using immunohistochemistry.
(B) Quantification of each marker as a percentage of Phox2a+/Lmx1b+ neurons.
(C–F) Phox2a expression in control (C), Ascl1 null (D), and Ptf1a null (E) E11.5 spinal cords, with the average number of Phox2a+ cells per section quantified in (F). (C’), (D’), and (E’) show high magnification of boxed regions in (C), (D), and (E), respectively.
(G–J) Representative images from transverse sections of E4 chick neural tubes co-electroporated with the ePhox2a-GFP reporter and expression plasmids: control (Myc-tag only) (G), MycAscl1 (H), MycAscl1 and Prdm13 (I), or MycPtf1a (J). Insets show control Myc-tag, Prdm13, or Ptf1a expression.
(K) Diagram of Phox2a expression regulation showing direct transcriptional upregulation by Ascl1, upregulation by Lmx1b (Figure S5), and repression by Ptf1a. (L–P) Single-cell RNA-seq data analysis of dI5 (Lmx1b+) neurons (Delile et al., 2019).
(L and M) UMAP analysis (L) of Lmx1b+ neurons from E9.5–E13.5 compared between each other, with volcano plot of cluster-6-enriched mRNAs (M) compared to all other neurons.
(N–P) UMAP analysis (N) of Lmx1b+ neurons from E9.5–E11.5 compared between each other, with volcano plots of cluster-2-enriched mRNAs (O) and cluster-3-enriched mRNAs (P) compared to all other neurons.
(Q–V) In situ hybridization of select mRNAs enriched in dI5 (Q; E11.5) and lamina I neurons (T; E16.5) based on UMAP analyses. The percentage of Phox2a+ neurons co-expressing selected mRNAs are quantified at both embryonic time points in (R) and (U). Tac1 is present in dI5 Lmx1b+ neurons and lamina I neurons that do not express Phox2a, as depicted in diagrams in (S) and (V).
Phox2aCre; R26LSL-tdT/+ embryos: (A and B) n = 3 E10.5; (Q and R) n = 3 E11.5; (T and U) n = 3–4 E16.5 embryos. (C–F) n = 6 control, n = 3 Ascl1GFP/GFP, and n = 4 Ptf1aCre/Cre embryos. (G–J) n = 6 E4 chicken embryos for each condition. Student’s t test in (F); **p < 0.01; ***p < 0.001. Data are represented as mean ± SEM. Data in (L)–(P) are derived from Delile et al. (2019); data processing and statistics are described in STAR Methods. Scale bars: 50 μm for all, except 10 μm for insets in (A). DRG, dorsal root ganglion; FC, fold change; MN, motor neuron.
