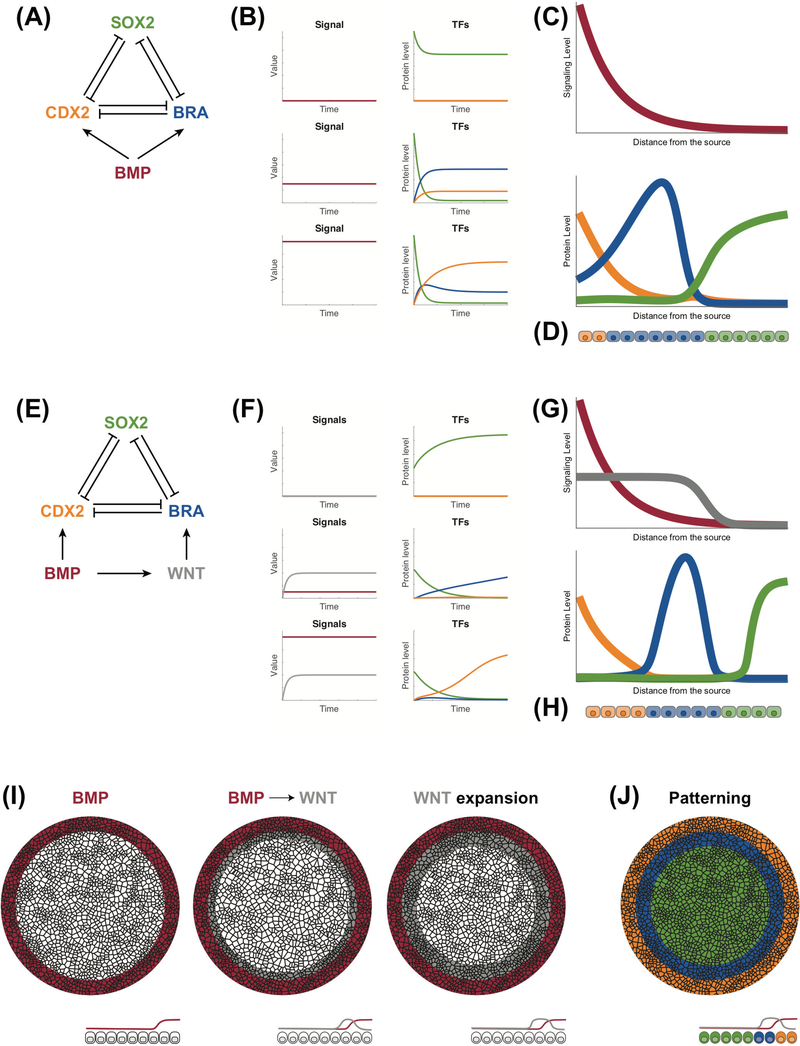
Figure 1: Mathematical models for signal induction.
(A) Classic model for morphogen induction: three mutually repressive transcription factors (CDX2, BRA, SOX2) are activated at different rates by the morphogen ligand, in this case BMP. (B) Dynamics of the transcriptional network under different morphogen concentrations. SOX2 (green) remains active under low morphogen concentration (top). At intermediate concentrations, BRA (blue) expression quickly increases inhibiting the other two TFs (middle). High morphogen concentrations promote CDX2 (yellow) expression (bottom). (C) Morphogen signaling gradient (top) and the corresponding TF expression profile (bottom) as functions of the distance from the source. For example, a cell that is at a distance from the source will be exposed to an intermediate BMP level and will express a high level of BRA (blue). (D) Pattern created in a row of cells exposed to the gradient signal showed in (C). (E) Transcriptional network mimicking morphogen induction by induction of a secondary signal: three mutually repressive transcription factors (CDX2, BRA, SOX2) are controlled by a balance of an upstream signal (BMP) and a secondary signal (WNT). (F) Dynamics of the transcriptional network under different initial concentrations of BMP. SOX2 (green) remains active under low BMP concentration (top). At intermediate BMP concentrations, the secondary signal, WNT, is quickly induced and BRA (blue) becomes active (middle). High BMP signal promotes high CDX2 (yellow) expression which overcomes BRA (blue) inhibition (bottom). (G) Signaling levels (top) and the corresponding TF expression profile (bottom) as functions of the distance from the source of BMP. (H) Pattern created in a row of cells exposed to the signaling levels showed in (G). The blue cells are only present due to the activation of the secondary signal and not to the BMP gradient directly. (I) Sketch of the signaling dynamics of a micropattern exposed to BMP signal. First, BMP signal is restricted to the edge of the colony. Secondly, BMP signal activates the secondary signal WNT at a distance from the edge, which expands inwards in the colony. (J) The signaling dynamics result into a pattern with three regions: extra-embryonic (yellow), mesendodermal (blue) and ectodermal (green).

