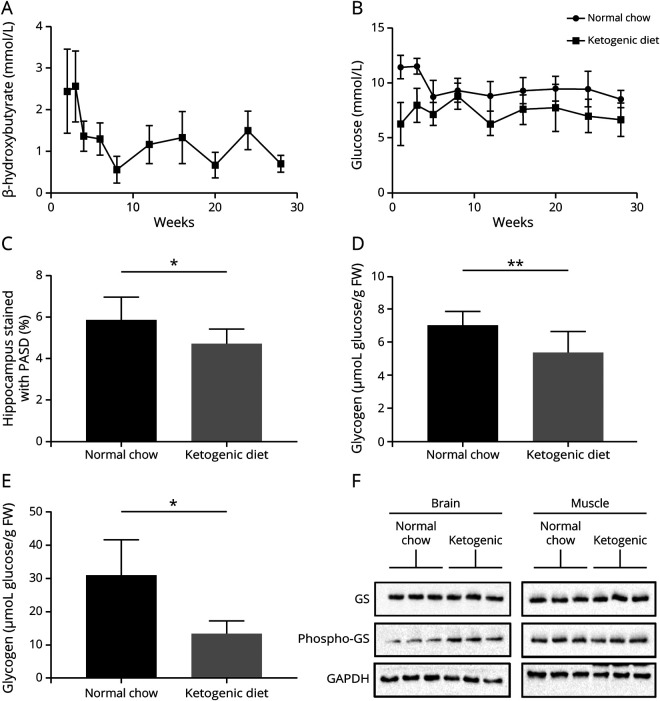
Figure. Blood β-hydroxybutyrate and glucose, hippocampal LB, total brain glycogen, total skeletal muscle glycogen, and brain phosphorylated GS levels in LD mice fed the ketogenic diet or normal chow.
(A) Blood β-hydroxybutyrate; time course begins 2 weeks following initiation of diet and concludes at 28 weeks; 6 mice per week. (B) Blood glucose; beginning at 1 week of diet introduction and concludes at 28 weeks; 5–8 mice per week. (C) Hippocampal LBs; 8–9 mice per group. (D) Total brain glycogen; 8–10 mice per group. (E) Skeletal muscle glycogen; 4 mice per group. Bars in A–E represent SD of the mean. Significance for all bar diagrams calculated using the unpaired Student t test; *p < 0.05; **p < 0.01. (F) Brain GS phosphorylation (inhibition) is increased in ketogenic diet–fed animals; 3 biological replicates per diet type. FW = fresh weight; GAPDH = glyceraldehyde 3-phosphate dehydrogenase; GS = glycogen synthase; LB = Lafora body; LD = Lafora disease; PASD = periodic acid–Schiff following diastase predigestion.

