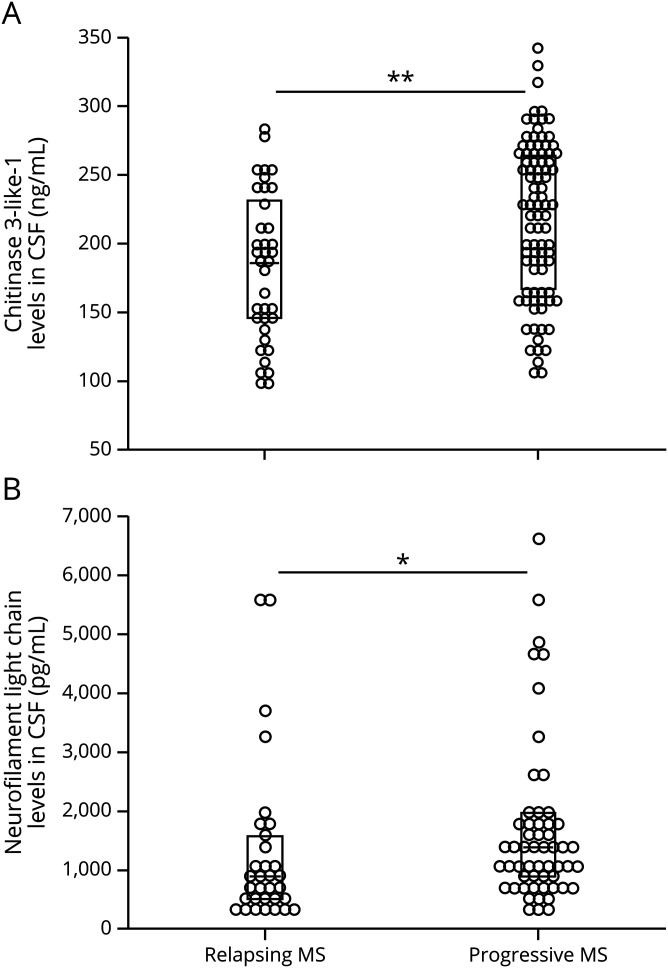
Figure 1. CHI3L1 (A) and NfL (B) concentrations in CSF of PMS and RMS.
The 2D plots depict the distribution of the results; the boxes mark the median and interquartile ranges. The 2D plots depict the distribution of the results; the boxes mark the median and interquartile ranges. *p < 0.050, **p < 0.001 in Mann-Whitney U tests. CHI3L1 = chitinase 3–like protein 1; NfL = neurofilament light chain; PMS = progressive MS; RMS = relapsing MS.

